Navy Federal Credit Union 2012 Annual Report Download - page 18
Download and view the complete annual report
Please find page 18 of the 2012 Navy Federal Credit Union annual report below. You can navigate through the pages in the report by either clicking on the pages listed below, or by using the keyword search tool below to find specific information within the annual report.-
 1
1 -
2
-
3
-
4
-
5
-
6
-
7
-
 8
8 -
 9
9 -
 10
10 -
 11
11 -
 12
12 -
 13
13 -
 14
14 -
 15
15 -
 16
16 -
 17
17 -
 18
18 -
 19
19 -
 20
20 -
 21
21 -
 22
22 -
 23
23 -
 24
24 -
 25
25 -
 26
26 -
 27
27 -
 28
28 -
29
-
30
-
31
-
32
-
33
-
34
-
35
 |
 |

Navy Federal Credit Union16 Leading with Vision. Achieving Results. 17
2012 Financial Section
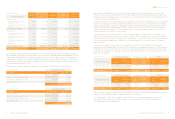
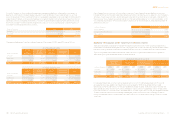
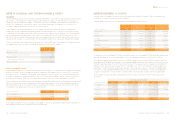
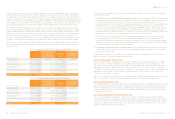
Navy Federal uses delinquency status and FICO score as the credit quality indicators for its credit
card loans, which consisted of the following as of December 31, 2012 and 2011:
As of December 31, 2012
(dollars in thousands) FICO Score
Delinquency Status Less than 610 Greater than
or equal to 610 Grand Total
<=60 days $ 1,035,974 $ 5,701,130 $ 6,737,104
>60 days 62,682 4,552 67,234
Total $ 1,098,656 $ 5,705,682 $ 6,804,338
Excludes fair value adjustments associated with the acquired portfolio of $(3.1) million.
As of December 31, 2011
(dollars in thousands) FICO Score
Delinquency Status Less than 610 Greater than or
equal to 610 Grand Total
<=60 days $ 842,934 $ 4,886,657 $ 5,729,591
>60 days 52,591 4,579 57,170
Total $ 895,525 $ 4,891,236 $ 5,786,761
Excludes fair value adjustments associated with the acquired portfolio of $(3.6) million.
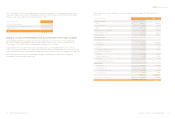
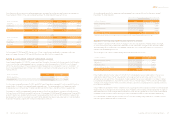
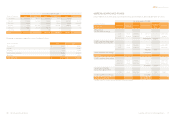
Navy Federal uses estimated current LTV ratios and FICO score as the credit quality indicators
for its mortgage loans, which consisted of the following as of December 31, 2012 and 2011:
As of December 31, 2012
(dollars in thousands) FICO Score
Estimated Current LTV Less than 610 Greater than
or equal to 610 Grand Total
Indeterminate* $ 107,608 $ 114,464 $ 222,072
<80% 232,576 6,295,655 6,528,231
80%–100% 190,414 4,294,133 4,484,547
+100% 206,398 2,727,492 2,933,890
Total $ 736,996 $ 13,431,744 $ 14,168,740
Excludes MLAS of $1,442.9 million, fair value adjustments associated with the acquired portfolio of $(23.3) million, deferred income,
net of $(84.1) million, and loans in process of $0.2 million.
*For Indeterminate category, 65% of the loan balances are associated with the acquired portfolio.
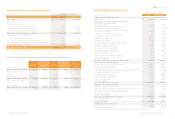
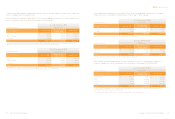
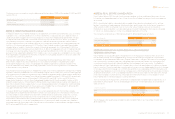
The following tables present credit quality indicators by loan product type: consumer loans, credit card
loans, mortgage loans, and equity loans.
Navy Federal uses collateral type and FICO score as the credit quality indicators for its consumer loans,
which consisted of the following as of December 31, 2012 and 2011:
As of December 31, 2012
(dollars in thousands) FICO Score
Collateral Group Less than 610 Greater than or
equal to 610 Grand Total
Auto $ 1,411,322 $ 5,455,114 $ 6,866,436
Other Collateral 188,675 502,893 691,568
Unsecured 409,987 1,476,162 1,886,149
Total $ 2,009,984 $ 7,434,169 $ 9,444,153
Excludes fair value adjustments associated with the acquired portfolio of $(1.3) million, deferred expense of $13.9 million, business, net of
$16.0 million, OLOC of $272.6 million, lease, net of $0.3 million, and federal education of $399.3 million.
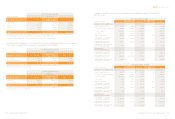
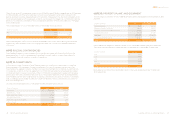
As of December 31, 2011
(dollars in thousands) FICO Score
Collateral Group Less than 610 Greater than or
equal to 610 Grand Total
Auto $ 1,208,278 $ 4,334,268 $ 5,542,546
Other Collateral 186,297 495,840 682,137
Unsecured 339,457 1,298,576 1,638,033
Total $ 1,734,032 $ 6,128,684 $ 7,862,716
Excludes fair value adjustments associated with the acquired portfolio of $(5.4) million, deferred expense of $12.7 million, business, net of
$10.4 million, OLOC of $265.3 million, lease, net of $2.4 million, and federal education of $469.8 million.