Navy Federal Credit Union 2012 Annual Report Download - page 12
Download and view the complete annual report
Please find page 12 of the 2012 Navy Federal Credit Union annual report below. You can navigate through the pages in the report by either clicking on the pages listed below, or by using the keyword search tool below to find specific information within the annual report.-
 1
1 -
 2
2 -
 3
3 -
 4
4 -
 5
5 -
 6
6 -
 7
7 -
 8
8 -
 9
9 -
 10
10 -
 11
11 -
 12
12 -
 13
13 -
 14
14 -
 15
15 -
 16
16 -
 17
17 -
 18
18 -
 19
19 -
 20
20 -
 21
21 -
 22
22 -
23
-
24
-
25
-
26
-
27
-
28
-
29
-
30
-
31
-
32
-
33
-
34
-
35
 |
 |

Navy Federal Credit Union4Leading with Vision. Achieving Results. 5
2012 Financial Section
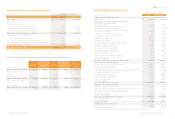
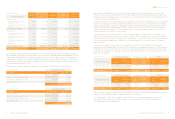
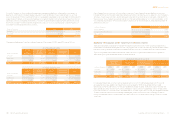
Consolidated Statements of Comprehensive Income
(dollars in thousands) Years Ended December 31
2012 2011
Net income $ 760,420 $ 649,328
Other Comprehensive Income
Defined benefit pension plans:
Prior service cost/(credit) amortized during period 4,813 4,813
Net unamortized (loss)/gain arising during period (64,774) (129,757)
Less: amortization of prior service cost included in net 22,976 11,374
Adjustments related to pension accounting (36,985) (113,570)
Unrealized gains on securities and derivatives
Unrealized holding gains arising during period 114,220 334,648
Less: reclassification adjustment for gains included in net income (40,123) 2,316
Net unrealized gain/(loss) on available-for-sale securities and derivatives 74,097 336,964
Total Other Comprehensive Income 37,112 223,394
Total Comprehensive Income $ 797,532 $ 872,722
The accompanying notes (beginning on page 6) are an integral part of these consolidated financial statements.
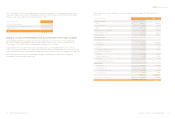
Consolidated Statements of Changes in Reserves and Undivided Earnings
(dollars in thousands)
Regular
Reserve
Capital
Reserve
Undivided
Earnings
Accumulated
Other
Comprehensive
Income
Total Reserves
and Undivided
Earnings
Balance at December 31, 2010 $ 349,808 $ 3,907,137 $ 50,000 $ (100,852) $ 4,206,093
Other comprehensive income — — — 223,394 223,394
Net income — — 649,328 — 649,328
Discretionary transfer — 649,328 (649,328) — —
Balance at December 31, 2011 349,808 4,556,465 50,000 122,542 5,078,815
Other comprehensive income — — — 37,112 37,112
Net income — — 760,420 — 760,420
Discretionary transfer — 760,420 (760,420) — —
Balance at December 31, 2012 $ 349,808 $ 5,316,885 $ 50,000 $ 159,654 $ 5,876,347
The accompanying notes (beginning on page 6) are an integral part of these consolidated financial statements.
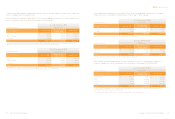
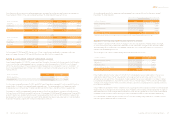
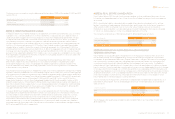
Consolidated Statements of Cash Flows
Years Ended December 31
(dollars in thousands) 2012 2011
Cash flows from operating activities
Net income $ 760,420 $ 649,328
Adjustments to reconcile net income to net cash
provided by operating activities
Provision for loan losses 455,189 450,661
Depreciation of property, plant, and equipment 122,224 101,026
Loss on disposal of property, plant, and equipment 1,505 1,516
Recovery of loss on membership capital in other credit unions (49) —
Gain on sale of investments (40,706) (22,399)
Amortization of loan origination fees and costs 3,525 11,219
Loss on change of value in mortgage servicing assets 51,053 51,258
Mortgage loans originated for sale (6,161,347) (3,022,064)
Gain on sale of mortgage loans (94,202) (43,312)
Mortgage loan sales proceeds 4,647,984 2,493,074
Accretion and amortization of AFS investment securities 72,350 42,163
Accretion and amortization of HTM investment securities 1,172 465
(Increase) in mortgage servicing assets (44,744) (29,483)
(Increase) in accrued interest receivable (8,386) (13,523)
(Increase)/decrease in prepaid expenses (1,177) 6,056
(Increase)/decrease in accounts receivable (31,009) 366,348
(Increase) in intangible and other assets (78,909) (93,262)
Increase in drafts payable 38,103 9,614
Increase in accrued expenses and accounts payable 86,680 33,832
Increase/(decrease) in accrued interest payable 741 (1,327)
Increase in other liabilities 34,506 41,681
Net cash (used in)/provided by operating activities (185,077) 1,032,871
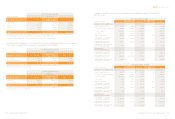
Cash flows from investing activities
Net increase in short-term and interest-bearing deposits (436,487) (485,851)
Purchases of AFS investment securities (4,152,670) (3,770,057)
Purchases of HTM investment securities (150,766) (49,621)
Proceeds from maturities, paydowns, calls, and sales of AFS investment securities 3,580,242 1,964,384
Proceeds from maturities, paydowns, and calls of HTM investment securities 474,371 99,145
Net (purchases)/redemptions of FHLB stock (29,438) 25,608
Net increase in loans to members (3,438,129) (514,490)
Purchase of property, plant, and equipment (294,275) (315,287)
Sale of property, plant, and equipment 158,124 176,878
Increase in deposit to NCUSIF (28,493) (19,315)
Proceeds from REO sales 37,496 43,515
Net cash used in investing activities (4,280,025) (2,845,091)
Cash flows from financing activities
Net increase in members’ accounts—other 2,967,755 2,493,510
Net increase/(decrease) in members’ accounts from issuance and maturity of CDs 740,610 (97,457)
Net increase in members’ accounts from borrowers’ escrow 17,002 8,124
Net increase in securities sold under repurchase agreements 50,000 —
Proceeds from borrowings 15,791,141 8,173,283
Repayment of notes payable (15,042,141) (8,806,873)
Net cash provided by financing activities 4,524,367 1,770,587
Net increase/(decrease) in cash 59,265 (41,633)
Cash at beginning of year 307,231 348,864
Cash at end of year $ 366,496 $ 307,231
Additional cash flow information:
Interest paid 657,249 680,044
Transfers from loans to other real estate 77,082 88,219
The accompanying notes (beginning on page 6) are an integral part of these consolidated financial statements.