Navy Federal Credit Union 2012 Annual Report Download - page 28
Download and view the complete annual report
Please find page 28 of the 2012 Navy Federal Credit Union annual report below. You can navigate through the pages in the report by either clicking on the pages listed below, or by using the keyword search tool below to find specific information within the annual report.-
 1
1 -
2
-
3
-
4
-
5
-
6
-
7
-
8
-
9
-
10
-
11
-
12
-
13
-
14
-
15
-
16
-
17
-
 18
18 -
 19
19 -
 20
20 -
 21
21 -
 22
22 -
 23
23 -
 24
24 -
 25
25 -
 26
26 -
 27
27 -
 28
28 -
 29
29 -
 30
30 -
 31
31 -
 32
32 -
 33
33 -
 34
34 -
 35
35
 |
 |

Navy Federal Credit Union36 Leading with Vision. Achieving Results. 37
2012 Financial Section
The following is a description of the valuation methodologies used for the Plan’s financial instruments
measured at fair value.
> U.S. Equity Securities & Global Equity Securities (Level 2)—As of December 31, 2012, the Plan invested
in one common collective trust. As of December 31, 2011, the Plan invested in one common collective
trust and one 103-12 investment entity. The trusts are valued at net asset value (NAV), which is
calculated based on the fair value of the underlying investments of the trusts. Most of the underlying
investments in these trusts are traded in markets that are considered to be active, but the trusts
themselves are not actively publicly traded, as they are marketed principally to institutional investors.
For those underlying investments that are not considered actively traded, the values are based on
quoted market prices, dealer quotations, or valuations from pricing sources supported by observable
inputs. As such, the trusts are classified within Level 2 of the fair value hierarchy.
Interest in the trusts can generally be purchased and sold at regular intervals. The trusts can be
purchased daily, monthly, or quarterly and can be redeemed daily or monthly, depending on the
investment. Contribution or redemption transaction requests for each of the trusts generally require
advance notice of two to 30 business days, depending on the investment. Trades are usually settled
no later than three business days after the trade date.
> Intermediate-Term Fixed Income Securities (Level 2)—The intermediate-term fixed income securities
are generally valued using benchmark yields, reported trades, and broker/dealer quotes for similar
assets in an active market.
There were no significant concentrations of risk within plan assets at December 31, 2012 and 2011, as
equity and fixed income assets are broadly diversified.
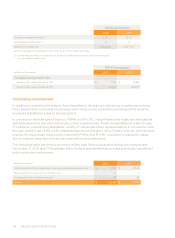
Navy Federal 401(k) Savings Plan
The Navy Federal 401(k) savings plan is a defined contribution plan where employees can contribute
pre-tax money to a 401(k) retirement account and receive employer matching contributions. The
matching contributions are based on participation in a defined benefit retirement plan. Employees
participating in the Cash Balance Plan receive a 100% employer match on the first 6% of pay they
contribute to their 401(k) accounts and are vested after completing two years of service. The employees
participating in the Traditional Plan receive an employer match of 50% on the first 6% of pay they
contribute to their 401(k) accounts.
The cost recognized for the 401(k) Plan, including matching contributions and administrative costs, was
$20.4 million and $17.3 million for the years ended December 31, 2012 and 2011, respectively.
Deferred Compensation Plan
Navy Federal deferred compensation plans are non-qualified, deferred compensation plans which oer a
before-tax savings opportunity to highly compensated employees. The annual deferral amount allowed
mirrors the 401(k) Plan, and contributions are held by Navy Federal and earn monthly interest based
on Navy Federal’s gross income for the month, divided by the average earnings on assets (loans and
investments) for the month.
Non-Qualified Supplemental Retirement Plan
This non-qualified plan is designed to “make up” for benefits not paid through the defined benefit
retirement plan as a result of limitations imposed by the IRS. The Internal Revenue Code Section 401(a)
(17) limits the amount of compensation that can be used in the defined benefit retirement plan’s annuity
calculation, and Internal Revenue Code Section 415 limits the amount of monthly annuity that can be
paid by the defined benefit retirement plan.
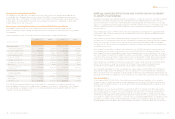
The investment strategy of the Navy Federal Credit Union Employees’ Retirement Plan is to employ an
investment approach, whereby a mix of equity and fixed income investments are used to maximize the
long-term return of plan assets at a prudent level of risk that includes consideration of benefit obligation
volatility. The intent of this strategy is to minimize plan expenses and keep the Plan well funded over the
long run. Risk tolerance is established through careful consideration of plan liabilities, plan-funded status, and
Navy Federal’s financial condition. Investment risk is measured and monitored on an ongoing basis through
annual liability measurements, periodic asset/liability studies, and quarterly investment portfolio reviews.
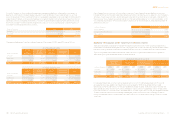
At December 31, 2012, the target allocation of plan assets was 32.5% U.S. equity securities, 32.5% global
equity securities, and 35.0% fixed income securities. Most of the U.S. equity assets are invested in a large
company index fund with the balance invested in mid- and small-company equity securities. Most of the
global equity allocation is in developed markets around the world, but investment managers are allowed
to invest in emerging markets, which make up about 13.0% of global equity markets. The fixed income
allocation comprises a small allocation to cash to provide liquidity for benefit and expense payments, with
the balance invested in intermediate- and long-term bonds, the majority of which are investment grade.
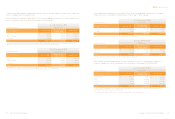
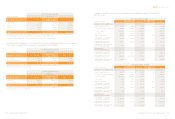
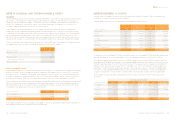
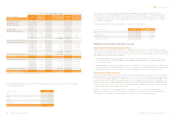
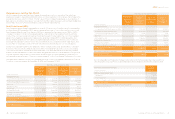
The fair values of Navy Federal’s Employees’ Retirement Plan assets, disclosed within their respective
fair value hierarchy (as described further in Note 21) at December 31, 2012 and 2011 by asset category
were as follows:
Fair Value Measurements at December 31, 2012
(dollars in thousands)
Total
Quoted Prices
in Active
Markets for
Identical Assets
Significant
Observable
Inputs
Significant
Unobservable
Inputs
Asset Category (Level 1) (Level 2) (Level 3)
U.S. equity securities $ 420,843 $ 66,730 $ 354,113 $ —
Global equity securities 191,726 191,726 — —
Intermediate-term fixed
income securities 179,401 45,492 133,909 —
Long-term fixed income securities 142,464 142,464 — —
Cash 39,242 39,242 — —
Total $ 973,676 $ 485,654 $ 488,022 $ —
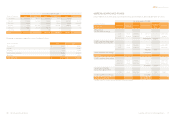
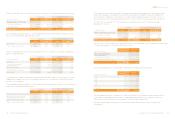
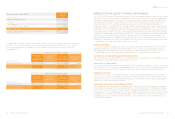
Fair Value Measurements at December 31, 2011
(dollars in thousands)
Total
Quoted Prices
in Active
Markets for
Identical Assets
Significant
Observable
Inputs
Significant
Unobservable
Inputs
Asset Category (Level 1) (Level 2) (Level 3)
U.S. equity securities $ 270,241 $ 57,995 $ 212,246 $ —
Global equity securities 271,242 156,789 114,453 —
Intermediate-term fixed
income securities 144,513 33,188 111,325 —
Long-term fixed income securities 124,810 124,810 — —
Cash 22,979 22,979 — —
Total $ 833,785 $ 395,761 $ 438,024 $ —