Microsoft 2005 Annual Report Download - page 7
Download and view the complete annual report
Please find page 7 of the 2005 Microsoft annual report below. You can navigate through the pages in the report by either clicking on the pages listed below, or by using the keyword search tool below to find specific information within the annual report.-
 1
1 -
 2
2 -
 3
3 -
 4
4 -
 5
5 -
 6
6 -
 7
7 -
 8
8 -
 9
9 -
 10
10 -
 11
11 -
 12
12 -
 13
13 -
 14
14 -
 15
15 -
 16
16 -
 17
17 -
 18
18 -
19
-
20
-
21
-
22
-
23
-
24
-
25
-
26
-
27
-
28
-
29
-
30
-
31
-
32
-
33
-
34
-
35
-
36
-
37
-
38
-
39
-
40
-
41
-
42
-
43
-
44
-
45
-
46
-
47
-
48
-
49
-
50
-
51
-
52
-
53
-
54
-
55
-
56
-
57
-
58
-
59
-
60
-
61
-
62
-
63
-
64
-
65
-
66
-
67
-
68
-
69
 |
 |

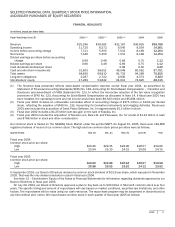
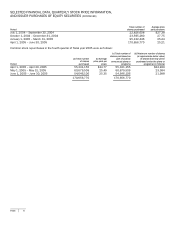
SELECTED FINANCIAL DATA, QUARTERLY STOCK PRICE INFORMATION,
AND ISSUER PURCHASES OF EQUITY SECURITIES (CONTINUED)
PAGE 6
Period
Total number
o
f
shares purchased
Average price
paid per share
July 1, 2004 – September 30, 2004 22,826,608 $27.38
October 1, 2004 – December 31, 2004 23,595,280 27.75
January 1, 2005 – March 31, 2005 95,122,446 25.44
April 1, 2005 – June 30, 2005 170,656,770 25.21
Common stock repurchases in the fourth quarter of fiscal year 2005 were as follows:
Period
(a) Total number
of shares
purchased
(b) Average
price paid per
share
(c)
Total
number o
f
shares purchased as
part of publicl
y
announced plans or
programs
(d) Maximum
number
of
shares
(or approximate dollar value)
of shares that may yet be
purchased under the plans or
programs (in millions)
April 1, 2005 – April 30, 2005 55,331,155 $24.77 55,331,155 $24,930
May 1, 2005 – May 31, 2005 60,679,509 25.49 60,679,509 23,384
June 1, 2005 – June 30, 2005 54,646,106 25.35 54,646,106 21,998
170,656,770 170,656,770