Microsoft 2005 Annual Report Download - page 47
Download and view the complete annual report
Please find page 47 of the 2005 Microsoft annual report below. You can navigate through the pages in the report by either clicking on the pages listed below, or by using the keyword search tool below to find specific information within the annual report.-
 1
1 -
2
-
3
-
4
-
5
-
6
-
7
-
8
-
9
-
10
-
11
-
12
-
13
-
14
-
15
-
16
-
17
-
18
-
19
-
20
-
21
-
22
-
23
-
24
-
25
-
26
-
27
-
28
-
29
-
30
-
31
-
32
-
33
-
34
-
35
-
36
-
 37
37 -
 38
38 -
 39
39 -
 40
40 -
 41
41 -
 42
42 -
 43
43 -
 44
44 -
 45
45 -
 46
46 -
 47
47 -
 48
48 -
 49
49 -
 50
50 -
 51
51 -
 52
52 -
 53
53 -
 54
54 -
 55
55 -
 56
56 -
 57
57 -
58
-
59
-
60
-
61
-
62
-
63
-
64
-
65
-
66
-
67
-
68
-
69
 |
 |

NOTES TO FINANCIAL STATEMENTS (CONTINUED)
PAGE 46
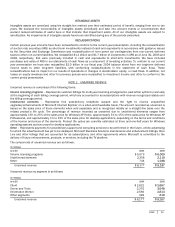
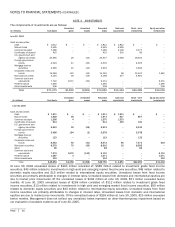
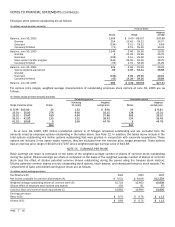
NOTE 3 INVESTMENTS
The components of investments are as follows:
(In millions) Cost basis
Unrealized
gains
Unrealized
losses
Recorded
basis
Cash and
equivalents
Short -
t
erm
investments
Equity
and
other
investments
June 30, 2004
Cash and securities
Cash $ 1,812 $ – $
–
$
1,812 $
1,812 $ – $
–
Mutual funds 3,595 – –
3,595 3,595 – –
Commercial paper 7,286 – –
7,286 4,109 3,177 –
Certificates of deposit 415 – –
415 330 85 –
U.S. government and
agency securities 20,565 26 (54)
20,537 4,083 16,454 –
Foreign government
bonds 4,524 41 (60)
4,505 – 4,505 –
Mortgage backed
securities 3,656 21 (42)
3,635 – 3,635 –
Corporate notes and
bonds 15,048 122 (50)
15,120 98 13,541 1,481
Municipal securities 5,154 39 (25)
5,168 277 4,891 –
Common stock and
equivalents 7,722 1,571 (62)
9,231 – – 9,231
Preferred stock 1,290 – –
1,290 – – 1,290
Other investments 208 – –
208 – – 208
Total $71,275 $1,820 $(293)
$72,802 $14,304 $46,288 $12,210
(In millions) Cost basis
Unrealized
gains
Unrealized
losses
Recorded
basis
Cash and
equivalents
Short -
t
erm
investments
Equity
and
other
investments
June 30, 2005
Cash and securities
Cash $ 1,911 $ – $
–
$
1,911 $
1,911 $ – $
–
Mutual funds 1,636 38 –
1,674 817 857 –
Commercial paper 1,566 4 –
1,570 1,570 – –
Certificates of deposit 614 – –
614 453 161 –
U.S. government and
agency securities 9,943 29 (59)
9,913 – 9,913 –
Foreign government
bonds 5,486 194 (2)
5,678 – 5,678 –
Mortgage backed
securities 123 – –
123 – 123 –
Corporate notes and
bonds 8,053 50 (31)
8,072 80 7,473 519
Municipal securities 8,579 70 (33)
8,616 20 8,596 –
Other 99 – –
99 – 99 –
Common stock and
equivalents 7,273 1,970 (133)
9,110 – – 9,110
Preferred stock 1,067 4 –
1,071 – – 1,071
Other investments 304 – –
304 – – 304
Total $46,654 $2,359 $
(258)
$48,755 $
4,851 $32,900 $11,004
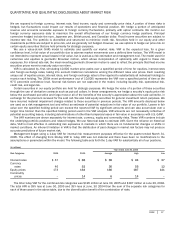
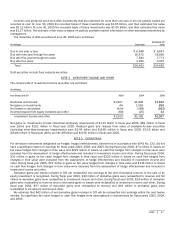
At June 30, 2004 unrealized losses of $293 million consisted of: $188 million related to investment grade fixed income
securities, $43 million related to investments in high yield and emerging market fixed income securities, $49 million related to
domestic equity securities and $13 million related to international equity securities. Unrealized losses from fixed income
securities are primarily attributable to changes in interest rates. Unrealized losses from domestic and international equities are
due to market price movements. Of the unrealized losses of $293 million at June 30, 2004, $51 million exceeded twelve
months. At June 30, 2005 unrealized losses of $258 million consisted of: $112 million related to investment grade fixed
income securities, $13 million related to investments in high yield and emerging market fixed income securities, $90 million
related to domestic equity securities and $43 million related to international equity securities. Unrealized losses from fixed
income securities are primarily attributable to changes in interest rates. Unrealized losses from domestic and international
equities are due to market price movements. Of the unrealized losses of $258 million at June 30, 2005, $25 million exceeded
twelve months. Management does not believe any unrealized losses represent an other-than-temporary impairment based on
our evaluation of available evidence as of June 30, 2005.