Microsoft 2005 Annual Report Download - page 57
Download and view the complete annual report
Please find page 57 of the 2005 Microsoft annual report below. You can navigate through the pages in the report by either clicking on the pages listed below, or by using the keyword search tool below to find specific information within the annual report.-
 1
1 -
2
-
3
-
4
-
5
-
6
-
7
-
8
-
9
-
10
-
11
-
12
-
13
-
14
-
15
-
16
-
17
-
18
-
19
-
20
-
21
-
22
-
23
-
24
-
25
-
26
-
27
-
28
-
29
-
30
-
31
-
32
-
33
-
34
-
35
-
36
-
37
-
38
-
39
-
40
-
41
-
42
-
43
-
44
-
45
-
46
-
 47
47 -
 48
48 -
 49
49 -
 50
50 -
 51
51 -
 52
52 -
 53
53 -
 54
54 -
 55
55 -
 56
56 -
 57
57 -
 58
58 -
 59
59 -
 60
60 -
 61
61 -
 62
62 -
 63
63 -
 64
64 -
 65
65 -
 66
66 -
 67
67 -
68
-
69
 |
 |

NOTES TO FINANCIAL STATEMENTS (CONTINUED)
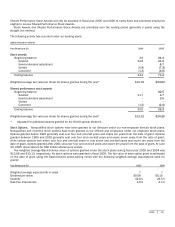
PAGE 56
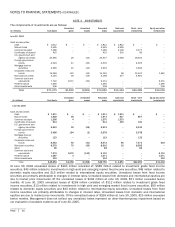
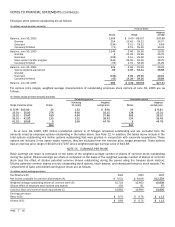
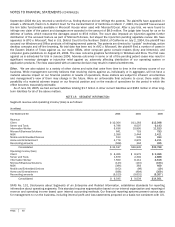
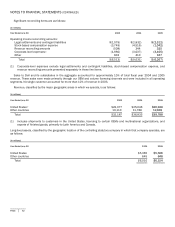
Employee stock options outstanding are as follows:
(In millions, except per share amounts)
Price per Share
Shares
Range Weighted
average
Balance, June 30, 2002
1,604
$ 0.40 – $59.57 $26.88
Granted
254
21.42 – 29.12
24.27
Exercised
(234
)
0.51 – 28.22
6.89
Canceled/forfeited
(75
)
2.13 – 59.56
34.33
Balance, June 30, 2003
1,549
0.40 – 59.56
29.30
Granted
2
25.46 – 29.96
26.76
Exercised
(198
)
0.51 – 29.38
12.21
Stock option transfer program
(345
)
33.03 – 59.56
38.70
Canceled/forfeited
(59
)
2.31 – 58.28
31.29
Balance, June 30, 2004
949
0.40 – 59.56
29.26
Special dividend adjustment
96
0.36 – 53.61
26.68
Granted
–
–
–
Exercised
(138
)
3.39 – 29.56
20.42
Canceled/forfeited
(43
)
14.29 – 58.28
28.89
Balance, June 30, 2005
864
$ 0.36 – $59.56 $27.41
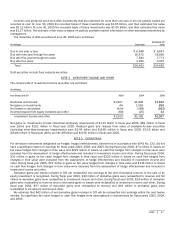
For various price ranges, weighted average characteristics of outstanding employee stock options at June 30, 2005 are as
follows:
(In millions, except per share amounts and years)
Outstanding options
Exercisable options
Range of exercise prices Shares
Remainin
g
life (years)
Weighted
average price
Shares Weighted
average price
$ 0.36 – $15.00 24 1.50
$
8.81
24
$
8.81
15.01 – 25.00 276 6.56
22.15
136
22.31
25.01 – 33.00 430 4.64
27.88
369
28.10
33.01 – 41.00 125 3.22
39.42
124
39.43
41.01 – 59.56 9 2.58
44.78
9
44.78
864
662
As of June 30, 2005, 345 million transferred options to JP Morgan remained outstanding and are excluded from the
amounts noted as employee options outstanding in the tables above. See Note 12. In addition, the tables above include in the
total options outstanding 4.3 million options outstanding that were granted in conjunction with corporate acquisitions. These
options are included in the option totals; however, they are excluded from the exercise price ranges presented. These options
had an exercise price range of $0.00 to $170.87 and a weighted average exercise price of $13.68.
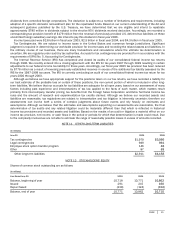
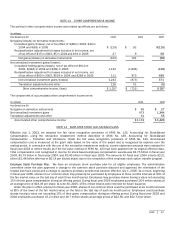
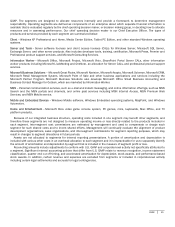
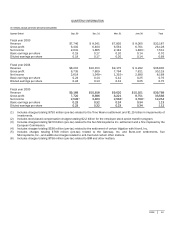
NOTE 15 EARNINGS PER SHARE
Basic earnings per share is computed on the basis of the weighted average number of shares of common stock outstanding
during the period. Diluted earnings per share is computed on the basis of the weighted average number of shares of common
stock plus the effect of dilutive potential common shares outstanding during the period using the treasury stock method.
Dilutive potential common shares include outstanding stock options, stock awards, and shared performance stock awards. The
components of basic and diluted earnings per share are as follows:
(In millions, except earnings per share)
Y
ear Ended June 30
2003
2004
2005
Net income available for common shareholders (A)
$
7,531
$ 8,168
$12,254
Weighted average outs
t
anding shares of common stock (B)
10,723
10,803
10,839
Dilutive effect of employee stock options and awards
159
91
67
Common stock and common stock equivalents (C)
10,882
10,894
10,906
Earnings per share:
Basic (A
/
B)
$
0.70
$ 0.76
$
1.13
Diluted (A/C)
$
0.69
$ 0.75
$
1.12