Microsoft 2005 Annual Report Download - page 41
Download and view the complete annual report
Please find page 41 of the 2005 Microsoft annual report below. You can navigate through the pages in the report by either clicking on the pages listed below, or by using the keyword search tool below to find specific information within the annual report.-
 1
1 -
2
-
3
-
4
-
5
-
6
-
7
-
8
-
9
-
10
-
11
-
12
-
13
-
14
-
15
-
16
-
17
-
18
-
19
-
20
-
21
-
22
-
23
-
24
-
25
-
26
-
27
-
28
-
29
-
30
-
 31
31 -
 32
32 -
 33
33 -
 34
34 -
 35
35 -
 36
36 -
 37
37 -
 38
38 -
 39
39 -
 40
40 -
 41
41 -
 42
42 -
 43
43 -
 44
44 -
 45
45 -
 46
46 -
 47
47 -
 48
48 -
 49
49 -
 50
50 -
 51
51 -
52
-
53
-
54
-
55
-
56
-
57
-
58
-
59
-
60
-
61
-
62
-
63
-
64
-
65
-
66
-
67
-
68
-
69
 |
 |

PAGE 40
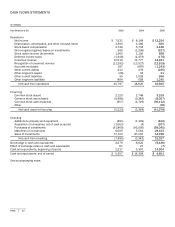
CASH FLOWS STATEMENTS
(In millions)
Y
ear Ended June 30
2003 2004 2005
Operations
Net income
$
7,531
$ 8,168
$
12,254
Depreciation, amortization, and other noncash items
1,393
1,186
855
Stock-based compensation
3,749
5,734
2,448
Net recognized (gains)/losses on investments
380
(1,296)
(527)
Stock option income tax benefits
1,365
1,100
668
Deferred income taxes
(1,348) (1,479)
(179)
Unearned revenue
12,519
11,777
13,831
Recognition of unearned revenue
(11,292) (12,527)
(12,919)
Accounts receivable
187
(687)
(1,243)
Other current assets
412
478
(245)
Other lon
g
-
t
erm assets
(28) 34
21
Other current liabilities
35
1,529
396
Other lon
g
-
t
erm liabilities
894
609
1,245
Net cash from operations
15,797
14,626
16,605
Financin
g
Common stock issued
2,120
2,748
3,109
Common stock repurchased
(6,486) (3,383)
(8,057)
Common stock cash dividends
(857) (1,729)
(36,112)
Other
–
–
(18)
Net cash used for financin
g
(5,223) (2,364)
(41,078)
Investin
g
Additions to property and equipment
(891) (1,109)
(812)
Acquisition of companies, net of cash acquired
(1,063) (4)
(207)
Purchases of investments
(91,869) (95,005)
(68,045)
Maturities of investments
9,205
5,561
29,153
Sales of investments
77,123
87,215
54,938
Net cash from investin
g
(7,495) (3,342)
15,027
Net change in cash and equivalents
3,079
8,920
(9,446)
Effect of exchange rates on cash and equivalents
61
27
(7)
Cash and equivalents, beginning of period
2,217
5,357
14,304
Cash and equivalents, end of period
$
5,357
$ 14,304
$
4,851
See accompanying notes.