Microsoft 2005 Annual Report Download - page 24
Download and view the complete annual report
Please find page 24 of the 2005 Microsoft annual report below. You can navigate through the pages in the report by either clicking on the pages listed below, or by using the keyword search tool below to find specific information within the annual report.-
 1
1 -
2
-
3
-
4
-
5
-
6
-
7
-
8
-
9
-
10
-
11
-
12
-
13
-
 14
14 -
 15
15 -
 16
16 -
 17
17 -
 18
18 -
 19
19 -
 20
20 -
 21
21 -
 22
22 -
 23
23 -
 24
24 -
 25
25 -
 26
26 -
 27
27 -
 28
28 -
 29
29 -
 30
30 -
 31
31 -
 32
32 -
 33
33 -
 34
34 -
35
-
36
-
37
-
38
-
39
-
40
-
41
-
42
-
43
-
44
-
45
-
46
-
47
-
48
-
49
-
50
-
51
-
52
-
53
-
54
-
55
-
56
-
57
-
58
-
59
-
60
-
61
-
62
-
63
-
64
-
65
-
66
-
67
-
68
-
69
 |
 |

PAGE 23
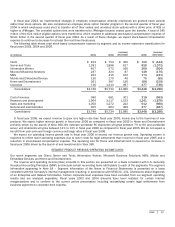
In fiscal year 2004, we implemented changes in employee compensation whereby employees are granted stock awards
rather than stock options. We also completed an employee stock option transfer program in the second quarter of fiscal year
2004 in which employees could elect to transfer all of their vested and unvested stock options with a strike price of $33 or
higher to JPMorgan. The unvested options that were transferred to JPMorgan became vested upon the transfer. A total of 345
million of the 621 million eligible options were transferred, which resulted in additional stock-based compensation expense of
$2.21 billion in the second quarter of fiscal year 2004. As a result of these changes, we expect stock-based compensation
expense to continue to decrease for at least the next three fiscal years.
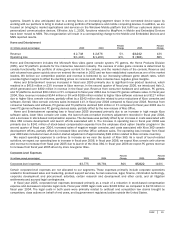
The following table shows total stock-based compensation expense by segment and by income statement classification for
fiscal years 2003, 2004 and 2005.
(In millions) 2003
2004
Increase/
(Decrease) 2005
Increase/
(Decrease)
Clien
t
$
454
$
754 $
300 $ 310
$
(444)
Server and Tools 1,281
1,898 617 826
(1,072)
Information Worker 407
573 166 269
(304)
Microsoft Business Solutions 237
324 87 149
(175)
MSN 263
415 152 174
(241)
Mobile and Embedded Devices 130
170 40 75
(95)
Home and Entertainment 261
387 126 168
(219)
Corporate 716
1,213 497 477
(736)
Consolidated $3,749
$5,734 $1,985 $2,448
$(3,286)
Cost of revenue 380
681 301 318
(363)
Research and developmen
t
1,964
3,117 1,153 1,241
(1,876)
Sales and marketin
g
1,050
1,272 222 612
(660)
General and administrative 355
664 309 277
(387)
Consolidated $3,749
$5,734 $1,985 $2,448
$(3,286)
In fiscal year 2006, we expect revenue to grow at a higher rate than fiscal year 2005, mainly due to the launches of new
products. We expect higher revenue growth in fiscal year 2006 as compared to fiscal year 2005 in Home and Entertainment
primarily driven by the launch of Xbox 360. We estimate worldwide PC shipments will grow between 7% to 9% and worldwide
server unit shipments will grow between 11% to 13% in fiscal year 2006 as compared to fiscal year 2005. We do not expect a
benefit from year-over-year foreign currency exchange rates in fiscal year 2006.
We expect our operating income growth rate in fiscal year 2006 to exceed our revenue growth rate. Operating income is
expected to reflect lower operating expenses due to lower costs for legal settlements than incurred in fiscal year 2005 and a
reduction in stock-based compensation expense. The operating loss for Home and Entertainment is expected to increase in
fiscal year 2006 driven by the launch of and investments in Xbox 360.
SEGMENT PRODUCT REVENUE/OPERATING INCOME (LOSS)
Our seven segments are Client; Server and Tools; Information Worker; Microsoft Business Solutions; MSN; Mobile and
Embedded Devices; and Home and Entertainment.
The revenue and operating income/(loss) amounts in this section are presented on a basis consistent with U.S. Generally
Accepted Accounting Principles (GAAP) and include certain reconciling items attributable to each of the segments. The segment
information appearing in Note 18 – Segment Information of the Notes to Financial Statements is presented on a basis
consistent with the Company’s internal management reporting, in accordance with SFAS No. 131, Disclosures about Segments
of an Enterprise and Related Information. Certain corporate level expenses have been excluded from our segment operating
results and are analyzed separately. Fiscal years 2003 and 2004 amounts have been restated for certain internal
reorganizations and to conform to the current period presentation including reclassifying certain legal settlements from
business segments to corporate-level expense.