Louis Vuitton 2004 Annual Report Download - page 19
Download and view the complete annual report
Please find page 19 of the 2004 Louis Vuitton annual report below. You can navigate through the pages in the report by either clicking on the pages listed below, or by using the keyword search tool below to find specific information within the annual report.-
 1
1 -
2
-
3
-
4
-
5
-
6
-
7
-
8
-
 9
9 -
 10
10 -
 11
11 -
 12
12 -
 13
13 -
 14
14 -
 15
15 -
 16
16 -
 17
17 -
 18
18 -
 19
19 -
 20
20 -
 21
21 -
 22
22 -
 23
23 -
 24
24 -
 25
25 -
 26
26 -
 27
27 -
 28
28 -
 29
29 -
30
-
31
-
32
-
33
-
34
-
35
-
36
-
37
-
38
-
39
-
40
-
41
-
42
-
43
-
44
-
45
-
46
-
47
-
48
-
49
-
50
-
51
-
52
-
53
-
54
-
55
-
56
-
57
-
58
-
59
-
60
-
61
-
62
-
63
-
64
-
65
-
66
-
67
-
68
-
69
-
70
-
71
-
72
-
73
-
74
-
75
-
76
-
77
-
78
-
79
-
80
-
81
-
82
-
83
-
84
-
85
-
86
-
87
-
88
-
89
-
90
-
91
-
92
-
93
-
94
-
95
-
96
-
97
-
98
-
99
-
100
-
101
-
102
-
103
-
104
-
105
-
106
-
107
-
108
-
109
-
110
-
111
-
112
-
113
 |
 |

LVMH annual report 2004
17
STOCK BUY-BACK PROGRAM
LV M H h a s implemented a stock buy-back
program, approved by the Annual
Shareholder’s Meeting of May 13, 2004,
which authorizes it to buy back up to
10% of its share capital. From January 1
to December 31, 2004, purchases, net of
sales, represented 3,064,247 shares, or
0.6% of its capital. The current stock buy-
back program was approved by the
French Autorité des Marchés Financiers
under No. 04-290 on April 19, 2004.
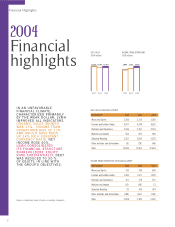
A PROGRESSING DIVIDEND
2002 2003 2004
Net dividend (EUR) 0.80 0.85 0.95*
Growth for the year 6.7% 6.3% 11.8%
Payout rate 48% 41% 36%
* Proposed resolution to be submitted at the AGM of May 12, 2005.
BREAKDOWN OF CAPITAL AND VOTING RIGHTS AT DECEMBER 31, 2004
Number of shares Number of voting rights % of capital % of voting rights
Groupe Arnault 232,819,190 440,934,905 147.52% 163.94%
Others(1) 257,118,220 248,703,960 152.48% 136.06%
Total 489,937,410 689,638,865 100.00% 100.00%
(1) At December 31, 2004, there were 20,442,787 treasury shares without voting rights.
SHARE DATA
(In EUR) 2000 2001 2002 2003 2004
Number of shares outstanding 489,858,345 489,901,115 1489,937,410 1489,937,410 489,937,410
Market capitalization (in millions) 34,535 22,388 119,181 128,269 27,608
High* 98.70 75.50 61.60 61.55 63.45
Low* 66.50 28.40 31.61 33.97 49.90
Year-end close* 70.50 45.70 39.15 57.70 56.35
Average daily trading volume 981,926 1,539,004 2,077,048 2,036,835 1,549,458
Average daily capital trades (in millions) 82.6 80.9 98.9 93.9 88.4
* Share prices adjusted for a five-for-one stock split on July 3, 2000.
CAPITAL STRUCTURE
(Euroclear France survey on bearer shares at year-end 2004)
17.4% French Institutional
investors
Individuals 8.0%
Groupe Arnault 47.5%
Treasury shares 4.2%
22.9% Foreign institutional
investors including:
United States: 5.0%
United Kingdom: 3.7%
Germany: 3.3%
Switzerland: 3.5%