LG 2002 Annual Report Download - page 3
Download and view the complete annual report
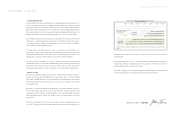
Please find page 3 of the 2002 LG annual report below. You can navigate through the pages in the report by either clicking on the pages listed below, or by using the keyword search tool below to find specific information within the annual report.-
 1
1 -
 2
2 -
 3
3 -
 4
4 -
 5
5 -
 6
6 -
 7
7 -
 8
8 -
 9
9 -
 10
10 -
 11
11 -
 12
12 -
 13
13 -
 14
14 -
15
-
16
-
17
-
18
-
19
-
20
-
21
-
22
-
23
-
24
-
25
-
26
-
27
-
28
-
29
-
30
-
31
-
32
-
33
-
34
-
35
-
36
-
37
-
38
-
39
-
40
-
41
-
42
 |
 |
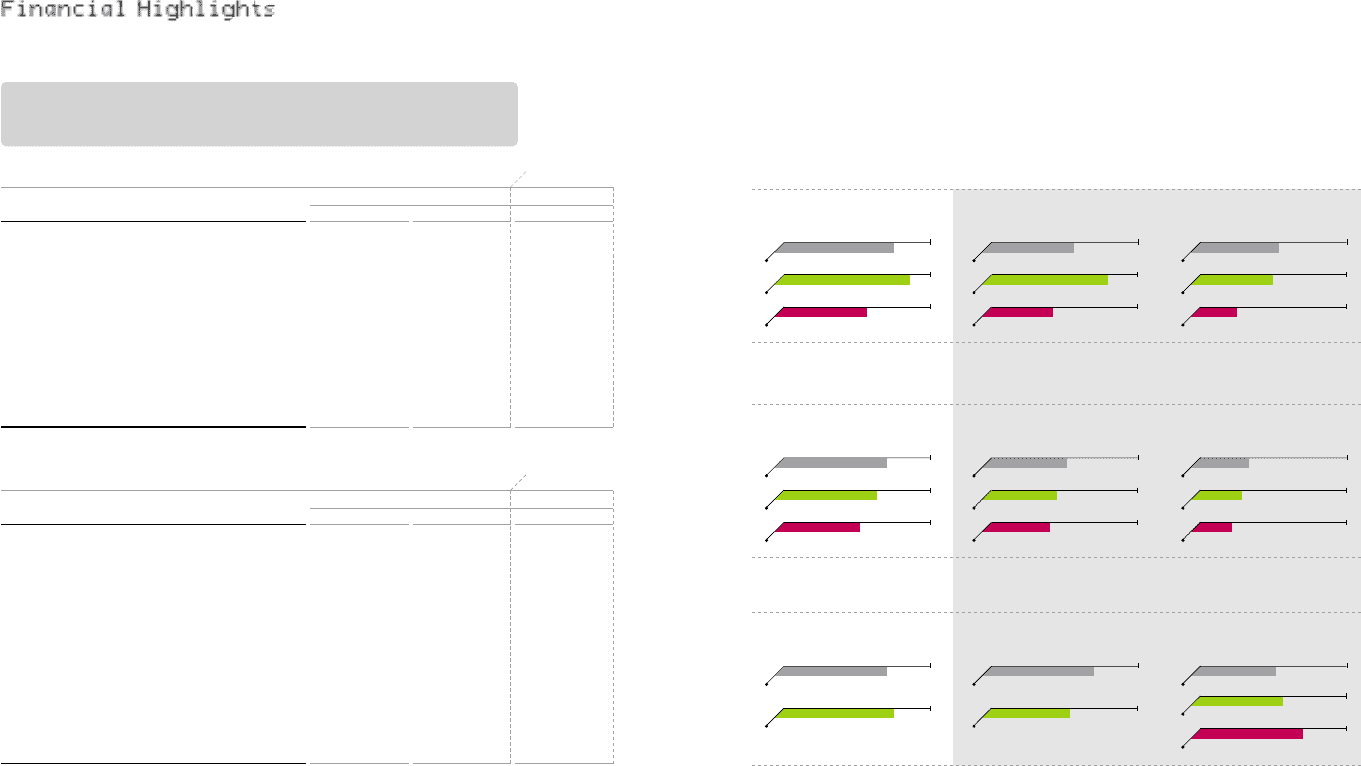
LG Electronics Inc. IAnnual Report 2002 I02 03
18,603
13,905
2002 2001
April-December Pro forma (prior to demerger) January-December
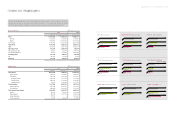
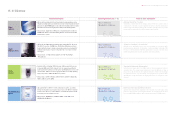
Sales 13,905,098 18,602,926 16,600,971
Domestic 5,054,523 6,654,949 6,083,981
Exports 8,850,575 11,947,977 10,516,990
Cost of Sales 10,731,086 14,253,644 12,914,998
Gross Profit 3,174,012 4,349,282 3,685,973
SG&A 2,512,339 3,320,702 2,890,007
Operating Profit 661,673 1,028,580 795,966
Non-operating Income 473,710 721,097 2,145,066
Non-operating Expenses 736,270 1,074,446 2,367,332
Recurring Profit 399,113 675,231 573,700
Tax 121,397 177,679 66,418
Net Profit 277,716 497,552 507,282
(Millions of Korean Won)
Income Statement
The financial highlights and figures for 2002 reflect LG Electronics results from April 1, 2002 to December 31, 2002, post
demerger, and the results of the entire fiscal year ended on December 31, 2002, assuming no demerger. The official
first-term financial statements of LG Electronics are based on the nine-month period from April to December 2002.
(Billions of Korean Won)
Sales
01
2002 2001
December 31 Effective April 1 December 31
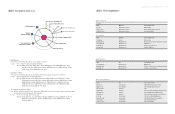
Total Assets 10,132,578 9,443,488 11,592,985
Current Assets 2,962,609 2,608,846 2,485,024
Fixed Assets 7,169,969 6,834,642 9,107,961
Investment Assets 3,304,130 3,010,810 5,113,304
Tangible Assets 2,893,372 2,792,980 2,923,487
Intangible Assets 972,467 1,030,852 1,071,170
Total Liabilities 7,127,526 6,627,781 7,327,749
Current Liabilities 4,736,639 4,231,719 4,614,085
Fixed Liabilities 2,390,887 2,396,062 2,713,664
Total Shareholders’ Equity 3,005,052 2,815,707 4,265,236
Capital 783,961 783,961 1,031,068
Capital Surplus 1,876,153 1,876,153 2,353,626
Retained Earnings 277,716 - 1,451,991
Capital Adjustment 67,222 155,593 -571,449
(Millions of Korean Won)
Balance Sheet
(Billions of Korean Won)
Operating Profit
(Billions of Korean Won)
Net Profit
(Pro forma)
(April-December)
(April 1)
Total Assets Total Liabilities Total Shareholders’ Equity
R&D Investment Capex Debt-to-equity Ratio
16,601
02
02
1,029
662
01
(Pro forma)
(April-December)
796
02
02
498
278
01
(Pro forma)
(April-December)
507
02
02
10,133
9,443
01
(December 31)
11,593
02
02
7,128
6,628
01
(December 31)
(April 1)
7,328
02
02
3,005
2,816
01
(December 31)
(April 1)
4,265
02
02
96.3
01
(April 1)
(December 31)
94.9
02
02
689
01
(January-December)
629
02
533
01
(January-December)
706
02
128.3
(Billions of Korean Won) (Billions of Korean Won)
(Billions of Korean Won)
(%)
(Billions of Korean Won)
(Billions of Korean Won)
LG전자 - 본문 2003.4 .22 7:14 AM 페이지6