LG 2002 Annual Report Download - page 25
Download and view the complete annual report
Please find page 25 of the 2002 LG annual report below. You can navigate through the pages in the report by either clicking on the pages listed below, or by using the keyword search tool below to find specific information within the annual report.-
 1
1 -
2
-
3
-
4
-
5
-
6
-
7
-
8
-
9
-
10
-
11
-
12
-
13
-
14
-
 15
15 -
 16
16 -
 17
17 -
 18
18 -
 19
19 -
 20
20 -
 21
21 -
 22
22 -
 23
23 -
 24
24 -
 25
25 -
 26
26 -
 27
27 -
 28
28 -
 29
29 -
 30
30 -
 31
31 -
 32
32 -
 33
33 -
 34
34 -
 35
35 -
36
-
37
-
38
-
39
-
40
-
41
-
42
 |
 |
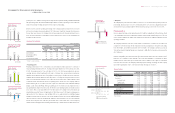
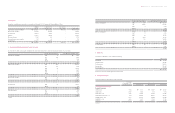
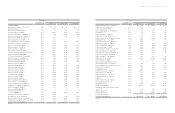
Debt Maturity
(Billions of Korean won, Millions of U.S. dollar)
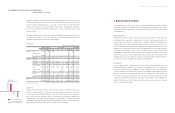
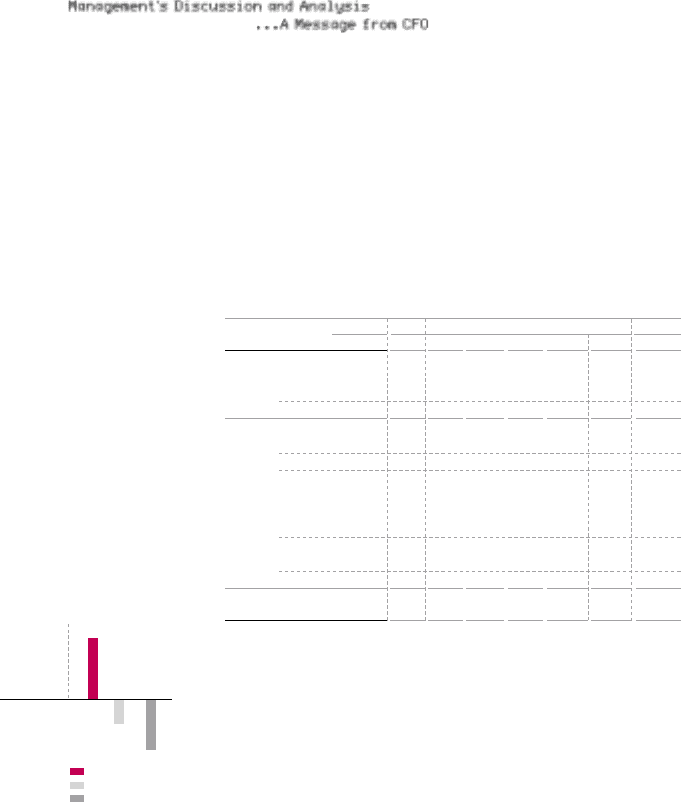
Cash Flow from Operating Activities
Cash Flow from Financing Activities
Cash Flow form Investing Activities
Cash Flows
1,507
690
909
LG Electronics Inc. IAnnual Report 2002 I46 47
(Billions of Korean won)
Short-term Won 44.7 42.4 42.4 42.4 -
Foreign Currency 7.2 - -
(US$5)
Sub Total 51.9 42.4 42.4 - - - 42.4 -
Long-term Won Loans 28.5 0.2 - 0.2
Won Bonds 3,135.0 2,140.0 100.0 270.0 200.0 570.0 1,570.0
Sub Total 3,163.5 2,140.2 100.0 270.0 - 200.0 570.0 1,570.2
Foreign Currency 260.4 19.9 2.2 8.0 1.7 3.5 15.4 4.5
Loans (US$196) (US$17) (US$2) (US$7) (US$1) (US$3) (US$13) (US$4)
Foreign Currency 632.1 720.2 118.0 118.0 602.2
Bonds (US$477) (US$600) (US$100) (US$100) (US$500)
Sub Total 892.5 740.1 2.2 8.0 119.7 3.5 133.4 606.7
(US$673) (US$617) (US$2) (US$7) (US$101) (US$3) (US$113) (US$504)
Total 4,056.0 2,880.3 102.2 278.0 119.7 203.5 703.4 2,176.9
Total 4,107.9 2,922.7 144.6 278.0 119.7 203.5 745.8 2,176.9
(US$678) (US$617) (US$2) (US$7) (US$101) (US$3) (US$113) (US$504)
2001 2002 Due in 2003 After 2003
Balance Balance 1Q 2Q 3Q 4Q Sub Total Total
* Bonds are based on par value.
Meanwhile, the liability-to-equity ratio remained almost unchanged during the period because the increase in
total liabilities was fully offset by the increase in shareholders’ equity. Liability-to-equity as of April 1 was
235.4% and was barely changed at 237.2% as of the end of 2002. The ratio of won-denominated debt
declined to 74.7% while that of foreign currency debt increased to 25.3%. The total amount of borrowings
due in 2003 is 745.8 billion won, which the Company plans to continue to repay with the help of robust
operating cash flow.
Shareholders’ equity was reduced to 2.82 trillion won just after the demerger, from 4.47 trillion won as of the
end of March 2002. However, it rose to 3.01 trillion won, 189.4 billion won higher than the initial
shareholders’ equity mainly due to the increase in retained earnings.
Cash flows
Cash flows for the nine months from April 1 to the end of fiscal year 2002 are summarized as follows: cash
inflows from operating activities of 1.51 trillion won, cash outflows from investing activities of 908.8 billion
won and cash outflows from financing activities of 690.2 billion won. Operating cash flows comprised net
profit of 277.7 billion won, depreciation expenses of 447.8 billion won and increases in liabilities from
operating activities. Cash outflows from investing activities were attributable to investment in investment
securities and tangible assets while cash outflows from financing activities were due to debt repayment. As a
result, cash at the end of the year was reduced by 91.8 billion won to 17.2 billion won.
2. Business outlook for 2003
The following statements are made on the basis of the Company’s strategies and reasonable assumptions
based on the several factors. For information, the new accounting principles will be adopted. Thus, “ sales on
raw material (outsourcing related sales),” which was included sales in the past, will be excluded in the
financial statements.
Sales and profits
Overall business conditions in 2003 are expected to be less favorable than they were in the previous few
years. Soaring oil prices coupled with a strong Korean won are likely to exert a negative influence on the
Company’s operations. However, the Company expects to manage the difficulties and uncertainties by
maintaining high growth in mobile handset sales, high-end home and consumer electronic goods such as
digital TVs, PDPs and home theater systems in 2003. Furthermore, the Company will maintain a cash-oriented
strategy. So far, the Company has carried out rigorous restructuring activities and will continue to rationalize
the monitor and PC businesses. In 2003, the effect is likely to be more evident, especially in the
Telecommunication System Division, which underwent radical restructuring. Net income of the Division is
expected to swing to surplus in 2003. The Digital Appliance Division, which generated more than half of total
operating profit in 2002, should continue to be a major source of income through the strategic placement of
new products on the market and higher brand recognition in the global market.
Investments
Under the assumption that the business environment for 2003 is likely to be less favorable than in 2002, the
Company will maintain a cautious stance on investments. The Company will focus on core businesses of
PDPs, mobile handsets, digital TVs and OLEDs in order to strengthen its position as a leading global
electronics company. Since these businesses are expected to grow robustly and generate higher profits in the
future, the Company will devote more capital to them. In 2003, the Company plans to invest 770 billion won
in new facilities, an increase of 236.6 billion won over 2002. Moreover, the Company will strengthen its R&D
capability in core businesses in 2003 by investing 980 billion won, the highest ever and significantly more
than the 689.2 billion won in 2002. Through such investments, LG Electronics intends to become a stronger
and more competitive global company.
LG전자 - 본문 2003.4 .22 7:15 AM 페이지50