LG 2002 Annual Report Download - page 24
Download and view the complete annual report
Please find page 24 of the 2002 LG annual report below. You can navigate through the pages in the report by either clicking on the pages listed below, or by using the keyword search tool below to find specific information within the annual report.-
 1
1 -
2
-
3
-
4
-
5
-
6
-
7
-
8
-
9
-
10
-
11
-
12
-
13
-
 14
14 -
 15
15 -
 16
16 -
 17
17 -
 18
18 -
 19
19 -
 20
20 -
 21
21 -
 22
22 -
 23
23 -
 24
24 -
 25
25 -
 26
26 -
 27
27 -
 28
28 -
 29
29 -
 30
30 -
 31
31 -
 32
32 -
 33
33 -
 34
34 -
35
-
36
-
37
-
38
-
39
-
40
-
41
-
42
 |
 |
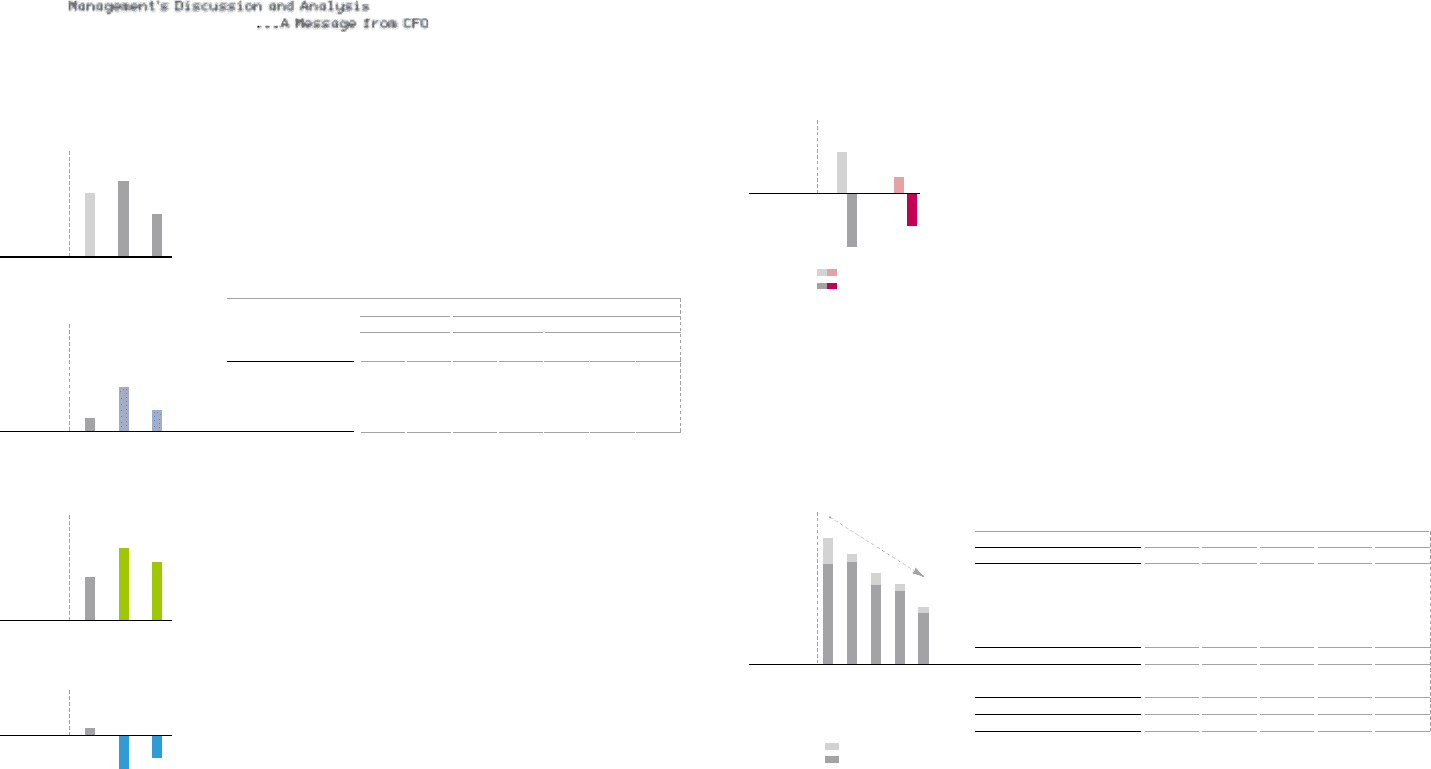
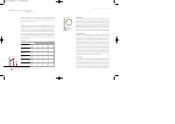
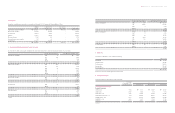
Financial Position
Interest-bearing Debt
Net Interest-bearing Debt
Liability-to-equity Ratio(%)
168.2 235.4 221.9 209.7 237.2
Debt-to-equity Ratio(% )
90.6 128.3 107.0 96.9 96.3
Interest-bearing Debt
02.3.31 02.4.1 02.6.30 02.9.30 02.12.31
3.6
3.2 3.1
2.9
3.5
4.0
3.5
3.1 3.0
2.8
(Trillions of Korean Won)
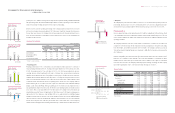
Digital Appliance
Operating Profit (margin)
(12.1%)
(10.0%)
602
604
(1.5% )
(3.2% )
100
258
(6.5% )
(9.7% )
157
343
(1.8% )
26
-74
(-8.2%)
(8.8% )
385
(2.4% )
141
(8.9% )
244
-35
(-4.7%)
(Billions of Korean Won)
01 02 02
01 02 02
April-December
01 02 02
April-December
01
02 02
April-December
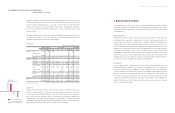
Total Assets 11,983 9,444 10,133 -1,850 689
Current Assets 3,342 2,609 2,963 -379 354
Fixed Assets 8,641 6,835 7,170 -1,471 335
Investment Assets 4,767 3,011 3,304 -1,463 293
Tangible Assets 2,843 2,793 2,893 50 100
Intangible Assets 1,031 1,031 973 -58 -58
Total Liabilities 7,515 6,628 7,128 -387 500
Current Liabilities 4,932 4,232 4,737 -195 505
Fixed Liabilities 2,583 2,396 2,391 -192 -5
Total Shareholders’ Equity 4,468 2,816 3,005 -1,463 189
Total Liabilities and Shareholders’ Equity 11,983 9,444 10,133 -1,850 689
2002.3(a) 2002.4.1(b) 2002.12(c) (c)-(a) (c)-(b)
* Day of demerger
(Billions of Korean Won)
Non-operating
Income & Expenses
2,145
2,367
720
1,074
01 02
(Billions of Korean Won)
Non-operating Income
Non-operating Expenses
LG Electronics Inc. IAnnual Report 2002 I44 45
Operating Profit by Division
Digital Appliance 602 12.1% 604 10.0% 385 8.8% 0.3
Digital Display & Media 100 1.5% 258 3.2% 141 2.4% 157.4
Mobile Handset 157 6.5% 343 9.7% 244 8.9% 117.9
Telecommunication System 26 1.8% -74 -8.2% -35 -4.7% N/A
Operating Margin Operating M argin Operating Margin
Profit Profit Profit
2001 2002 Change(%)
(Billions of Korean Won)
January-December Pro forma April-December
* Change % is year-on-year basis.
Digital Display & Media
Operating Profit (margin)
(Billions of Korean Won)
Mobile Handset
Operating Profit (margin)
(Billions of Korean Won)
Telecommunication System
Operating Profit (margin)
(Billions of Korean Won)
April-December
previous year’s 1.5% thanks to robust growth of newly introduced products including combination DVD/VCRs
and optical storage units. The Telecommunication System Division recorded an operating loss of 73.9 billion, its
largest ever, mainly due to falling sales and the effects of vigorous restructuring.
Of note, however, is that the operating profit margin of the Company would have improved to 6.3% had it
not been for performance bonuses amounting to 145.1 billion won. Usually the Company reflects bonuses in
the next fiscal year. However, the Company reflected bonus payments in the financial statements twice in
2002: once in the first quarter for performance bonuses in fiscal year 2001 and once in the fourth quarter for
performance bonuses in 2002.
> Recurring profit
Recurring profit increased 17.7% to 675.2 billion won in 2002 from 573.7 billion won in 2001 on the back of
robust operating performance. Moreover, recurring profit margin remained close to the previous year’s level.
In 2002, the margin was up by 0.1%p on the figure for 2001 to 3.6%. Both non-operating income and non-
operating expenses declined significantly in the wake of demerger since non-operating accounting was
simplified. Non-operating income fell to 720.2 billion won in 2002 from 2.15 trillion won in 2001 while non-
operating expenses declined sharply from 2.37 trillion won to 1.07 trillion won during the same period. As a
result, net non-operating loss widened by 131.1 billion won to 353.4 billion won. A large reduction in gains
on business transfer was behind the fall in non-operating income. In June 2001, the Company realized a
business transfer gain of 1.36 trillion won when it spun off its CRT business and established LG.Philips
Displays, a joint venture with Philips. Although a further gain of 139.3 billion won was realized in 2002, it
was significantly less than in the previous year. The decline in non-operating expenses, meanwhile, was due
to two factors. First, loss on equity method of 901.5 billion won in 2001, arising from losses by Dacom, LG
Industrial Systems and LG Telecom, fell significantly to 143.4 billion won in 2002. Despite realizing gains on
equity method of 183.4 billion won from LG.Philips LCD, loss on equity method from LG.Philips Displays
totaling 394.4 billion won was reflected on the income statement. Most of the loss from LG.Philips Displays
came from disposal of property and equipment during the restructuring carried out to boost profitability.
Second, interest expenses were reduced by 149.8 billion won to 242.7 billion won in 2002, helped by
reduction in interest-bearing debt. Interest-bearing debt decreased by 1.16 trillion won to 2.89 trillion won in 2002.
> Net profit
The Company’s net profit totaled 497.6 billion won in 2002, a 1.9% decrease from the previous year. The net
profit margin, which stood at 3.1% in 2001, deteriorated a little to 2.7% in 2002 as adjustments in income
and expenses for tax accounting brought the effective income tax rate up to 26.3% from 11.6% in 2001.
Financial position
Here we compare the balance sheet ending December 2002 with that ending March 2002 and that as of April
1, the initial balance sheet of the Company after demerger, instead of that ending December 2001. This is in
order to analyze separately the changes in the balance sheet caused by the Company’s financial policy and
operating performance.
The company’s total assets at the end of 2002 totaled 10.13 trillion won, a reduction of 1.85 trillion won
compared to 11.98 trillion won at the end of March in 2002. This was mainly due to the split of assets arising
from the demerger, as investment assets which were not related to the Company’s operation, such as LG
Telecom, Dacom and LG Industrial Systems, were transferred to LGEI. After the demerger, assets increased by
689.1 billion won.
Likewise, total liabilities were reduced by 387.3 billion won during the same period, but increased by 499.7
billion won to 7.13 trillion won after demerger. The increase was attributable to a big change in current
liabilities. However, debt declined by 718.7 billion won from 3.61 trillion won as of April 1 to 2.89 trillion
won at the end of 2002 since the Company continuously repaid borrowings. Accordingly, the debt-to-equity
ratio declined significantly to 96.3% at the end of 2002 from the initial ratio of 128.3%.
LG전자 - 본문 2003.4 .22 7:15 AM 페이지48