JCPenney 2006 Annual Report Download - page 5
Download and view the complete annual report
Please find page 5 of the 2006 JCPenney annual report below. You can navigate through the pages in the report by either clicking on the pages listed below, or by using the keyword search tool below to find specific information within the annual report.-
 1
1 -
 2
2 -
 3
3 -
 4
4 -
 5
5 -
 6
6 -
 7
7 -
 8
8 -
 9
9 -
 10
10 -
 11
11 -
 12
12 -
 13
13 -
 14
14 -
 15
15 -
 16
16 -
17
-
18
-
19
-
20
-
21
-
22
-
23
-
24
 |
 |

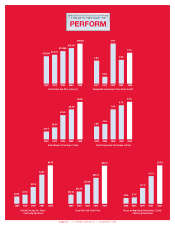
Operating Income Percentage of Sales
Retail Sales, Net ($ in millions)
Fiscal Year-End Stock PriceDiluted Earnings Per Share –
Continuing Operations
Gross Margin Percentage of Sales
Comparable Department Store Sales Growth
Return on Beginning Stockholders’ Equity–
Continuing Operations
2002 2003 2004 2005 2006
2.8%
0.8%
4.9%
2.9%
3.7%
4.6% 5.7%
2002 2003 2004 2005 2006
2002 2003 2004 2005 2006
2002 2003 2004 2005 2006 2002 2003 2004 2005 2006
2002 2003 2004 2005 2006 2002 2003 2004 2005 2006
$17,384 $17,513
$18,096
$18,781
$19,903
35.1%
35.8%
37.5%
38.3%
39.3%
3.6% 4.5%
7.0%
8.7%
9.7%
$0.95 $1.20
$2.20
$3.83
$4.88
$19.39
$26.18
$41.69
$56.21
$83.70
TODAY’S THE DAY TO
PERFORM
12.1%
20.1%
28.3%
page five l J. C. Penney Company, Inc. l Annual Report 2006