JCPenney 2006 Annual Report Download - page 20
Download and view the complete annual report
Please find page 20 of the 2006 JCPenney annual report below. You can navigate through the pages in the report by either clicking on the pages listed below, or by using the keyword search tool below to find specific information within the annual report.-
 1
1 -
2
-
3
-
4
-
5
-
6
-
7
-
8
-
9
-
 10
10 -
 11
11 -
 12
12 -
 13
13 -
 14
14 -
 15
15 -
 16
16 -
 17
17 -
 18
18 -
 19
19 -
 20
20 -
 21
21 -
 22
22 -
 23
23 -
 24
24
 |
 |
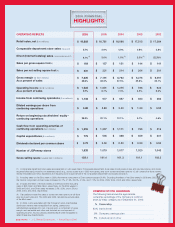
(1) Comparable department store sales are presented on a 52-week basis. Comparable department store sales include sales of new and relocated stores, and stores
reopened after being closed for an extended period (e.g., stores closed due to 2005 hurricanes), after such stores have been open for 12 full consecutive fiscal months.
Stores remodeled and minor expansions not requiring store closure remain in the comparable department store sales calculation.
(2) Including sales for the 53rd week of 2006, the Internet component of Direct sales increased 24.4%. Excluding the effect of the 53rd weeks in 2006 and 2003,
the Internet component of Direct sales increased 22.1%, 27.9%, 34.0%, 47.9%, and 17.3% for 2006, 2005, 2004, 2003, and 2002, respectively.
(3) Includes the effect of the 53rd weeks in 2006 and 2003. Excluding
sales of $50 million and $46 million, respectively, for the 53rd weeks in
2006 and 2003, total Direct sales increased 2.4%, 3.3%, and 1.5% for
2006, 2004, and 2003, respectively.
(4) Calculations include the sales of stores that were open for a full fiscal
year as of each year end. The 2006 and 2003 calculations exclude sales
of the 53rd week.
(5) In 2006, costs associated with the Company’s store merchandise
distribution centers were reclassified from selling, general and
administrative expenses into cost of goods sold, a component of gross
margin, and real estate and other was included as a component of
operating income. All prior periods presented have been reclassified to
reflect these new classifications.
2006 FINANCIAL
HIGHLIGHTS
COMMON STOCK HOLDINGS
The following table shows the approximate
ownership percentage of the Company’s common
stock by major category as of December 31, 2006:
% Ownership
83% Institutional
9% Company savings plan
8% Individual and other
OPERATING RESULTS
Retail sales, net ($ in millions)
Comparable department store sales increase(1)
Direct (Internet/catalog) sales increase/(decrease)(2)
Sales per gross square foot(4)
Sales per net selling square foot(4)
Gross margin (5) ($ in millions)
As a percent of sales
Operating income (5) ($ in millions)
As a percent of sales
Income from continuing operations ($ in millions)
Diluted earnings per share from
continuing operations
Return on beginning stockholders’ equity -
continuing operations
Cash flow from operating activities of
continuing operations ($ in millions)
Capital expenditures ($ in millions)
Dividends declared per common share
Number of JCPenney stores
Gross selling space (square feet in millions)
2006
$ 19,903
3.7%
4.1%
$ 164
$ 231
$ 7,825
39.3%
$ 1,922
9.7%
$ 1,134
$ 4.88
28.3%
$ 1,255
$ 772
$ 0.72
1,033
103.1
(3)
2004
$ 18,096
4.9%
1.5%
$ 151
$ 214
$ 6,792
37.5%
$ 1,275
7.0%
$ 657
$ 2.20
12.1%
$ 1,111
$ 398
$ 0.50
1,017
101.3
(3)
2003
$ 17,513
0.8%
3.3%
$ 144
$ 204
$ 6,276
35.8%
$ 786
4.5%
$ 360
$ 1.20
5.7%
$ 795
$ 359
$ 0.50
1,020
101.1
(3)
2002
$ 17,384
2.8%
(22.0)%
$ 141
$ 201
$ 6,097
35.1%
$ 624
3.6%
$ 283
$ 0.95
4.6%
$ 516
$ 307
$ 0.50
1,043
103.3
2005
$ 18,781
2.9%
3.6%
$ 157
$ 221
$ 7,191
38.3%
$ 1,631
8.7%
$ 977
$ 3.83
20.1%
$ 1,337
$ 535
$ 0.50
1,019
101.4
page twenty l J. C. Penney Company, Inc. l Annual Report 2006