Hertz 2015 Annual Report Download - page 93
Download and view the complete annual report
Please find page 93 of the 2015 Hertz annual report below. You can navigate through the pages in the report by either clicking on the pages listed below, or by using the keyword search tool below to find specific information within the annual report.-
 1
1 -
2
-
3
-
4
-
5
-
6
-
7
-
8
-
9
-
10
-
11
-
12
-
13
-
14
-
15
-
16
-
17
-
18
-
19
-
20
-
21
-
22
-
23
-
24
-
25
-
26
-
27
-
28
-
29
-
30
-
31
-
32
-
33
-
34
-
35
-
36
-
37
-
38
-
39
-
40
-
41
-
42
-
43
-
44
-
45
-
46
-
47
-
48
-
49
-
50
-
51
-
52
-
53
-
54
-
55
-
56
-
57
-
58
-
59
-
60
-
61
-
62
-
63
-
64
-
65
-
66
-
67
-
68
-
69
-
70
-
71
-
72
-
73
-
74
-
75
-
76
-
77
-
78
-
79
-
80
-
81
-
82
-
 83
83 -
 84
84 -
 85
85 -
 86
86 -
 87
87 -
 88
88 -
 89
89 -
 90
90 -
 91
91 -
 92
92 -
 93
93 -
 94
94 -
 95
95 -
 96
96 -
 97
97 -
 98
98 -
 99
99 -
 100
100 -
 101
101 -
 102
102 -
 103
103 -
104
-
105
-
106
-
107
-
108
-
109
-
110
-
111
-
112
-
113
-
114
-
115
-
116
-
117
-
118
-
119
-
120
-
121
-
122
-
123
-
124
-
125
-
126
-
127
-
128
-
129
-
130
-
131
-
132
-
133
-
134
-
135
-
136
-
137
-
138
-
139
-
140
-
141
-
142
-
143
-
144
-
145
-
146
-
147
-
148
-
149
-
150
-
151
-
152
-
153
-
154
-
155
-
156
-
157
-
158
-
159
-
160
-
161
-
162
-
163
-
164
-
165
-
166
-
167
-
168
-
169
-
170
-
171
-
172
-
173
-
174
-
175
-
176
-
177
-
178
-
179
-
180
-
181
-
182
-
183
-
184
-
185
-
186
-
187
-
188
-
189
-
190
-
191
-
192
-
193
-
194
-
195
-
196
-
197
-
198
-
199
-
200
-
201
-
202
-
203
-
204
-
205
-
206
-
207
-
208
-
209
-
210
-
211
-
212
-
213
-
214
-
215
-
216
-
217
-
218
-
219
-
220
-
221
-
222
-
223
-
224
-
225
-
226
-
227
-
228
-
229
-
230
-
231
 |
 |

Table of Contents
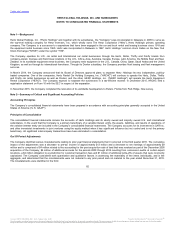
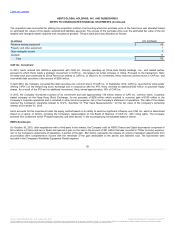
than its fair value, the second step is performed, where the implied fair value of goodwill is compared to its carrying value. The Company
recognizes an impairment charge for the amount by which the carrying amount of goodwill exceeds its implied fair value. The fair values of the
reporting units are estimated using the net present value of discounted cash flows generated by each reporting unit and incorporate various
assumptions related to discount and growth rates specific to the reporting unit to which they are applied. The Company’s discounted cash flows
are based upon reasonable and appropriate assumptions, which are weighted for their likely probability of occurrence, about the underlying
business activities of the Company’s reporting units.
Finite Lived Intangible Assets
Intangible assets include concession agreements, technology, customer relationships, trademarks and trade names and other intangibles.
Intangible assets with finite lives are amortized using the straight-line method over the estimated economic lives of the assets, which range from
two to sixteen years. Long-lived assets, including intangible assets with finite lives, are reviewed for impairment whenever events or changes in
circumstances indicate that the carrying amount of such assets may not be recoverable. Determination of recoverability is based on an estimate
of undiscounted future cash flows resulting from the use of the asset and its eventual disposition. Measurement of an impairment loss for long-
lived assets that management expects to hold and use is based on the estimated fair value of the asset. Long-lived assets to be disposed of are
reported at the lower of carrying amount or estimated fair value less costs to sell.
Financial Instruments
The Company is exposed to a variety of market risks, including the effects of changes in interest rates, gasoline and diesel fuel prices and foreign
currency exchange rates. The Company manages exposure to these market risks through regular operating and financing activities and, when
deemed appropriate, through the use of financial instruments. Financial instruments are viewed as risk management tools and have not been used
for speculative or trading purposes. In addition, financial instruments are entered into with a diversified group of major financial institutions in order
to manage the Company's exposure to counterparty nonperformance on such instruments. The Company accounts for all financial instruments in
accordance with U.S. GAAP, which requires that they be recorded on the balance sheet as either assets or liabilities measured at their fair value.
For financial instruments that are designated and qualify as hedging instruments, the Company designates the hedging instrument, based upon the
exposure being hedged, as either a fair value hedge or a cash flow hedge. The effective portion of changes in fair value of financial instruments
designated as cash flow hedging instruments is recorded as a component of other comprehensive income (loss). Amounts included in
accumulated other comprehensive income (loss) for cash flow hedges are reclassified into earnings in the same period that the hedged item is
recognized in earnings. The ineffective portion of changes in the fair value of financial instruments designated as cash flow hedges is recognized
currently in earnings within the same line item as the hedged item, based upon the nature of the hedged item. For financial instruments that are not
part of a qualified hedging relationship, the changes in their fair value are recognized currently in earnings.
Stock-Based Compensation
The Company measures the cost of employee services received in exchange for an award of equity instruments based on the grant date fair value
of the award. That cost is to be recognized over the period during which the employee is required to provide service in exchange for the award. The
Company has estimated the fair value of options issued at the date of grant using a Black-Scholes option-pricing model, which includes
assumptions related to volatility, expected life, dividend yield and risk-free interest rate.
The Company accounts for restricted stock unit and performance stock unit awards as equity classified awards. For restricted stock units the
expense is based on the grant-date fair value of the stock and the number of shares that vest, recognized over the service period. For
performance stock units the expense is based on the grant-date fair value of the stock, recognized over a two to four year service period
depending upon the applicable performance condition. For performance stock units, the Company re-assesses the probability of achieving the
applicable performance condition each reporting period and adjusts the recognition of expense accordingly.
85
℠
The information contained herein may not be copied, adapted or distributed and is not warranted to be accurate, complete or timely. The user assumes all risks for any damages or losses arising from any use of this information,
except to the extent such damages or losses cannot be limited or excluded by applicable law. Past financial performance is no guarantee of future results.