Hertz 2015 Annual Report Download - page 59
Download and view the complete annual report
Please find page 59 of the 2015 Hertz annual report below. You can navigate through the pages in the report by either clicking on the pages listed below, or by using the keyword search tool below to find specific information within the annual report.-
 1
1 -
2
-
3
-
4
-
5
-
6
-
7
-
8
-
9
-
10
-
11
-
12
-
13
-
14
-
15
-
16
-
17
-
18
-
19
-
20
-
21
-
22
-
23
-
24
-
25
-
26
-
27
-
28
-
29
-
30
-
31
-
32
-
33
-
34
-
35
-
36
-
37
-
38
-
39
-
40
-
41
-
42
-
43
-
44
-
45
-
46
-
47
-
48
-
 49
49 -
 50
50 -
 51
51 -
 52
52 -
 53
53 -
 54
54 -
 55
55 -
 56
56 -
 57
57 -
 58
58 -
 59
59 -
 60
60 -
 61
61 -
 62
62 -
 63
63 -
 64
64 -
 65
65 -
 66
66 -
 67
67 -
 68
68 -
 69
69 -
70
-
71
-
72
-
73
-
74
-
75
-
76
-
77
-
78
-
79
-
80
-
81
-
82
-
83
-
84
-
85
-
86
-
87
-
88
-
89
-
90
-
91
-
92
-
93
-
94
-
95
-
96
-
97
-
98
-
99
-
100
-
101
-
102
-
103
-
104
-
105
-
106
-
107
-
108
-
109
-
110
-
111
-
112
-
113
-
114
-
115
-
116
-
117
-
118
-
119
-
120
-
121
-
122
-
123
-
124
-
125
-
126
-
127
-
128
-
129
-
130
-
131
-
132
-
133
-
134
-
135
-
136
-
137
-
138
-
139
-
140
-
141
-
142
-
143
-
144
-
145
-
146
-
147
-
148
-
149
-
150
-
151
-
152
-
153
-
154
-
155
-
156
-
157
-
158
-
159
-
160
-
161
-
162
-
163
-
164
-
165
-
166
-
167
-
168
-
169
-
170
-
171
-
172
-
173
-
174
-
175
-
176
-
177
-
178
-
179
-
180
-
181
-
182
-
183
-
184
-
185
-
186
-
187
-
188
-
189
-
190
-
191
-
192
-
193
-
194
-
195
-
196
-
197
-
198
-
199
-
200
-
201
-
202
-
203
-
204
-
205
-
206
-
207
-
208
-
209
-
210
-
211
-
212
-
213
-
214
-
215
-
216
-
217
-
218
-
219
-
220
-
221
-
222
-
223
-
224
-
225
-
226
-
227
-
228
-
229
-
230
-
231
 |
 |

Table of Contents
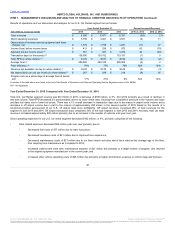
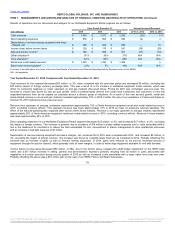
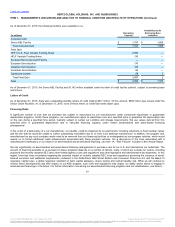
Our international car rental operations have approximately 5,545 corporate and franchisee locations in approximately 150 countries including
Australia, Canada, New Zealand and in the regions of Africa, Asia, Caribbean, Europe, Latin America, and the Middle East.
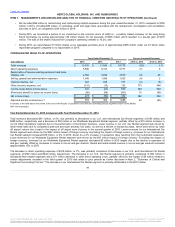
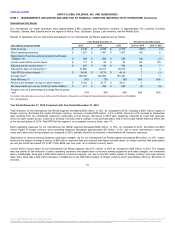
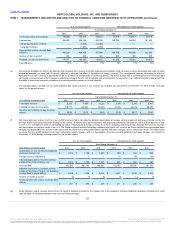
Results of operations and our discussion and analysis for our International Car Rental segment are as follows:
Total revenues $ 2,148
$ 2,436
$ 2,378
(12)%
2 %
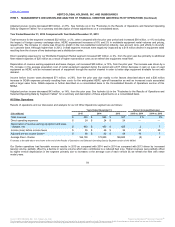
Direct operating expenses $ 1,251
$ 1,491
$ 1,407
(16)
6
Depreciation of revenue earning equipment and lease
charges, net $ 398
$ 492
$ 528
(19)
(7)
Income (loss) before income taxes $ 171
$ 95
$ 34
80
179
Adjusted pre-tax income (loss) (a) $ 215
$ 144
$ 134
49
7
Transaction days (in thousands) (b) 47,860
46,917
45,019
2
4
Total RPD (in whole dollars) (c) $ 48.45
$ 47.74
$ 48.14
1
(1)
Average fleet (d) 168,700
166,900
161,300
1
3
Fleet efficiency (d) 78%
77%
76%
N/A
N/A
Revenue per available car day (in whole dollars) (e) $ 37.66
$ 36.77
$ 36.81
2
—
Net depreciation per unit per month (in whole dollars) (f) $ 211
$ 226
$ 248
(7)
(9)
Program cars as a percentage of average fleet at period
end 33%
30%
24%
N/A
N/A
Footnotes to the table above are shown at the end of the Results of Operations and Selected Operating Data by Segment section of this MD&A.
N/A - Not applicable
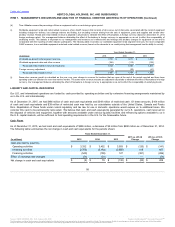
Total revenues for the International Car Rental segment decreased $288 million, or 12%, as compared to 2014, including a $367 million impact of
foreign currency. Excluding the impact of foreign currency, revenues increased $79 million, or 4% in 2015, driven by a 2% increase in transaction
days resulting from the multi-brand expansion, particularly across Europe. Revenues in 2015 were negatively impacted by lower fuel revenues
driven by lower market prices, a decline in ancillary fuel sales and a change in fuel purchase plans sold in the Europe market that took effect late
in the second quarter of 2014. Total RPD for the segment, on a constant currency basis, rose 1%.
Direct operating expenses for our International Car Rental segment decreased $240 million, or 16%, as compared to 2014. Excluding the $219
million impact of foreign currency, direct operating expenses decreased approximately $21 million, or 2%, due to lower commissions, lower fuel
costs and lower restructuring charges as compared to 2014, partially offset by an increase in fleet-related self insurance expenses.
Depreciation of revenue earning equipment and lease charges, net for our International Car Rental segment decreased $94 million, or 19%, mainly
driven by the impact of foreign currency of $65 million, improved fleet procurement and higher residual values on certain vehicles. Net depreciation
per unit per month decreased 7% to $211 from $226 year over year, on a constant currency basis.
Income before income taxes for our International Car Rental segment was $171 million in 2015 as compared to $95 million in 2014. The change
was due mainly to the reduction in direct operating expenses and depreciation of revenue earning equipment and lease charges, net mentioned
above. Additionally, there was a $25 million decline in interest expense, net, due to the $15 million impact of foreign currency and lower interest
rates. Also, there was a $22 million decrease in SG&A due to the $48 million impact of foreign currency which was partially offset by $9 million of
accruals,
51
℠
The information contained herein may not be copied, adapted or distributed and is not warranted to be accurate, complete or timely. The user assumes all risks for any damages or losses arising from any use of this information,
except to the extent such damages or losses cannot be limited or excluded by applicable law. Past financial performance is no guarantee of future results.