Hertz 2015 Annual Report Download - page 139
Download and view the complete annual report
Please find page 139 of the 2015 Hertz annual report below. You can navigate through the pages in the report by either clicking on the pages listed below, or by using the keyword search tool below to find specific information within the annual report.-
 1
1 -
2
-
3
-
4
-
5
-
6
-
7
-
8
-
9
-
10
-
11
-
12
-
13
-
14
-
15
-
16
-
17
-
18
-
19
-
20
-
21
-
22
-
23
-
24
-
25
-
26
-
27
-
28
-
29
-
30
-
31
-
32
-
33
-
34
-
35
-
36
-
37
-
38
-
39
-
40
-
41
-
42
-
43
-
44
-
45
-
46
-
47
-
48
-
49
-
50
-
51
-
52
-
53
-
54
-
55
-
56
-
57
-
58
-
59
-
60
-
61
-
62
-
63
-
64
-
65
-
66
-
67
-
68
-
69
-
70
-
71
-
72
-
73
-
74
-
75
-
76
-
77
-
78
-
79
-
80
-
81
-
82
-
83
-
84
-
85
-
86
-
87
-
88
-
89
-
90
-
91
-
92
-
93
-
94
-
95
-
96
-
97
-
98
-
99
-
100
-
101
-
102
-
103
-
104
-
105
-
106
-
107
-
108
-
109
-
110
-
111
-
112
-
113
-
114
-
115
-
116
-
117
-
118
-
119
-
120
-
121
-
122
-
123
-
124
-
125
-
126
-
127
-
128
-
 129
129 -
 130
130 -
 131
131 -
 132
132 -
 133
133 -
 134
134 -
 135
135 -
 136
136 -
 137
137 -
 138
138 -
 139
139 -
 140
140 -
 141
141 -
 142
142 -
 143
143 -
 144
144 -
 145
145 -
 146
146 -
 147
147 -
 148
148 -
 149
149 -
150
-
151
-
152
-
153
-
154
-
155
-
156
-
157
-
158
-
159
-
160
-
161
-
162
-
163
-
164
-
165
-
166
-
167
-
168
-
169
-
170
-
171
-
172
-
173
-
174
-
175
-
176
-
177
-
178
-
179
-
180
-
181
-
182
-
183
-
184
-
185
-
186
-
187
-
188
-
189
-
190
-
191
-
192
-
193
-
194
-
195
-
196
-
197
-
198
-
199
-
200
-
201
-
202
-
203
-
204
-
205
-
206
-
207
-
208
-
209
-
210
-
211
-
212
-
213
-
214
-
215
-
216
-
217
-
218
-
219
-
220
-
221
-
222
-
223
-
224
-
225
-
226
-
227
-
228
-
229
-
230
-
231
 |
 |

Table of Contents
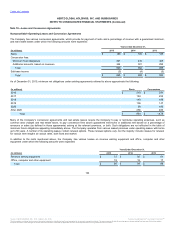
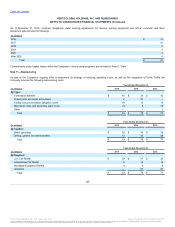
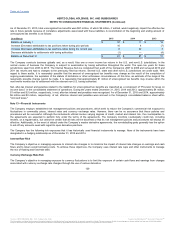
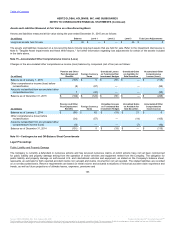
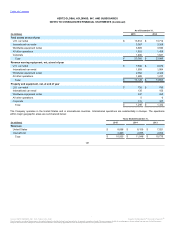
The impact of offsetting derivative instruments is depicted below as of December 31, 2014:
Interest rate caps $ 25
$ —
$ 25
$ —
$ 25
Foreign currency forward contracts 6
—
6
(3)
3
Total $ 31
$ —
$ 31
$ (3)
$ 28
Interest rate caps $ 25
$ —
$ 25
$ (1)
$ 24
Foreign currency forward contracts 2
—
2
(2)
—
Total $ 27
$ —
$ 27
$ (3)
$ 24
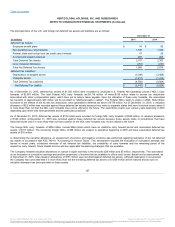
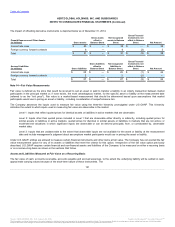
Fair value is defined as the price that would be received to sell an asset or paid to transfer a liability in an orderly transaction between market
participants in the principal market or, if none exists, the most advantageous market, for the specific asset or liability at the measurement date
(referred to as the "exit price"). Fair value is a market-based measurement that should be determined based upon assumptions that market
participants would use in pricing an asset or liability, including consideration of nonperformance risk.
The Company assesses the inputs used to measure fair value using the three-tier hierarchy promulgated under U.S.GAAP. This hierarchy
indicates the extent to which inputs used in measuring fair value are observable in the market.
Level 1: Inputs that reflect quoted prices for identical assets or liabilities in active markets that are observable.
Level 2: Inputs other than quoted prices included in Level 1 that are observable either directly or indirectly, including quoted prices for
similar assets or liabilities in active markets; quoted prices for identical or similar assets or liabilities in markets that are not active; or
model-derived valuations in which significant inputs are observable or can be derived principally from, or corroborated by, observable
market data.
Level 3: Inputs that are unobservable to the extent that observable inputs are not available for the asset or liability at the measurement
date and include management's judgment about assumptions market participants would use in pricing the asset or liability.
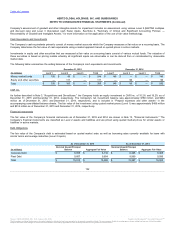
Under U.S.GAAP, entities are allowed to measure certain financial instruments and other items at fair value. The Company has not elected the fair
value measurement option for any of its assets or liabilities that meet the criteria for this option. Irrespective of the fair value option previously
described, U.S.GAAP requires certain financial and non-financial assets and liabilities of the Company to be measured on either a recurring basis
or on a nonrecurring basis as shown in the sections that follow.
The fair value of cash, accounts receivable, accounts payable and accrued expenses, to the extent the underlying liability will be settled in cash,
approximate carrying values because of the short-term nature of these instruments. The
131
℠
The information contained herein may not be copied, adapted or distributed and is not warranted to be accurate, complete or timely. The user assumes all risks for any damages or losses arising from any use of this information,
except to the extent such damages or losses cannot be limited or excluded by applicable law. Past financial performance is no guarantee of future results.