Hertz 2015 Annual Report Download - page 60
Download and view the complete annual report
Please find page 60 of the 2015 Hertz annual report below. You can navigate through the pages in the report by either clicking on the pages listed below, or by using the keyword search tool below to find specific information within the annual report.-
 1
1 -
2
-
3
-
4
-
5
-
6
-
7
-
8
-
9
-
10
-
11
-
12
-
13
-
14
-
15
-
16
-
17
-
18
-
19
-
20
-
21
-
22
-
23
-
24
-
25
-
26
-
27
-
28
-
29
-
30
-
31
-
32
-
33
-
34
-
35
-
36
-
37
-
38
-
39
-
40
-
41
-
42
-
43
-
44
-
45
-
46
-
47
-
48
-
49
-
 50
50 -
 51
51 -
 52
52 -
 53
53 -
 54
54 -
 55
55 -
 56
56 -
 57
57 -
 58
58 -
 59
59 -
 60
60 -
 61
61 -
 62
62 -
 63
63 -
 64
64 -
 65
65 -
 66
66 -
 67
67 -
 68
68 -
 69
69 -
 70
70 -
71
-
72
-
73
-
74
-
75
-
76
-
77
-
78
-
79
-
80
-
81
-
82
-
83
-
84
-
85
-
86
-
87
-
88
-
89
-
90
-
91
-
92
-
93
-
94
-
95
-
96
-
97
-
98
-
99
-
100
-
101
-
102
-
103
-
104
-
105
-
106
-
107
-
108
-
109
-
110
-
111
-
112
-
113
-
114
-
115
-
116
-
117
-
118
-
119
-
120
-
121
-
122
-
123
-
124
-
125
-
126
-
127
-
128
-
129
-
130
-
131
-
132
-
133
-
134
-
135
-
136
-
137
-
138
-
139
-
140
-
141
-
142
-
143
-
144
-
145
-
146
-
147
-
148
-
149
-
150
-
151
-
152
-
153
-
154
-
155
-
156
-
157
-
158
-
159
-
160
-
161
-
162
-
163
-
164
-
165
-
166
-
167
-
168
-
169
-
170
-
171
-
172
-
173
-
174
-
175
-
176
-
177
-
178
-
179
-
180
-
181
-
182
-
183
-
184
-
185
-
186
-
187
-
188
-
189
-
190
-
191
-
192
-
193
-
194
-
195
-
196
-
197
-
198
-
199
-
200
-
201
-
202
-
203
-
204
-
205
-
206
-
207
-
208
-
209
-
210
-
211
-
212
-
213
-
214
-
215
-
216
-
217
-
218
-
219
-
220
-
221
-
222
-
223
-
224
-
225
-
226
-
227
-
228
-
229
-
230
-
231
 |
 |

Table of Contents
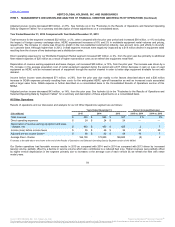
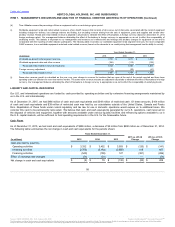
expenses, charges, and write-downs recorded in the second quarter of 2015 in connection with the termination of a contract. The above decreases
were partially offset by lower revenues and $23 million in charges recorded in relation to a French road tax matter. Excluding the overall impact of
foreign currency, income before income taxes increased $114 million driven by higher revenues and lower expenses as discussed above.
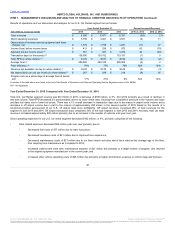
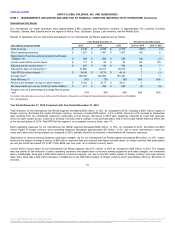
Adjusted pre-tax income for our International Car Rental segment was $215 million in 2015 as compared to $144 million in 2014. See footnote (a) in
the "Footnotes to the Results of Operations and Selected Operating Data by Segment Tables" for a summary and description of reconciling
adjustments on a consolidated basis.
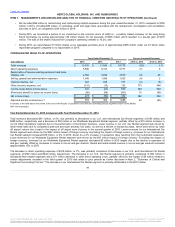
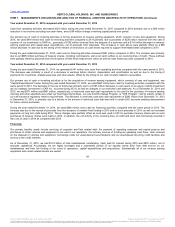
Total revenues for the segment increased $58 million, or 2%, when compared with the prior year period and increased $80 million, or 3% excluding
the impact of foreign currency exchange rates. We experienced a 4% increase in transaction days; however, Total RPD for the segment
decreased 1% due mainly to the expansion of our value brands, Firefly and Thrifty, in several European countries.
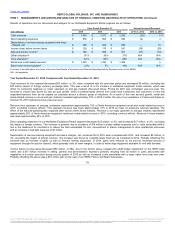
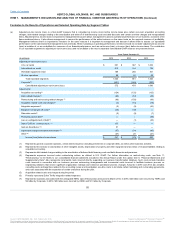
Direct operating expenses for our International Car Rental segment increased $84 million, or 6%, from the prior year due to the following:
• Fleet related expenses increased $50 million, or 13%, from 2013 primarily due to higher insurance and license fees of $29 million and
higher vehicle damage costs of $23 million. Insurance costs were higher due to increases in large loss property damage claims and
license fees increased due to a new toll product in Australia and increased conversion expenses from vehicle thefts in Italy. Damage
costs increased due to higher vehicle reconditioning costs and lower damage recoveries; and
• Other direct operating expenses increased $27 million during the period primarily due to higher commissions of $14 million driven by
growth in our value brand segments and higher facilities costs and concession fees of $13 million.
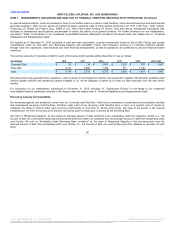
Depreciation of revenue earning equipment and lease charges, net decreased $36 million, or 7%, and net depreciation per unit per month
decreased 9% to $226 from $248 year over year. This change was mainly driven by improvements in fleet purchasing, vehicle mix and the gain
(loss) on vehicles sold during the period.
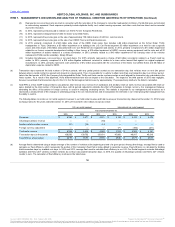
Income before income taxes increased $61 million, or 179%, from the prior year. The change was primarily due to the factors described above and
a $17 million decrease in interest expense, net driven by a lower average interest rate on fleet debt resulting from the European fleet financings
completed during the period. Additionally, there was a $25 million decrease in other (income) expenses, net which is further described on a
consolidated basis in the Consolidated Results of Operations section of this MD&A.
Adjusted pre-tax income increased $10 million, or 7%, from the prior year. See footnote (a) in the "Footnotes to the Results of Operations and
Selected Operating Data by Segment Tables" for a summary and description of these adjustments on a consolidated basis.
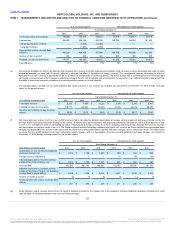
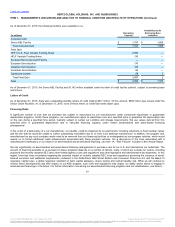
HERC has approximately 280 company-operated branches, of which approximately 270 are in the United States and Canada, and the remainder
are located in the United Kingdom, China and through joint venture arrangements in Saudi Arabia and Qatar. We also operate our equipment rental
business through franchisee owned branches in Greece, Iceland, Portugal and Corsica in Europe, in Afghanistan in the Middle East, in Panama in
Central America and in Chile in South America.
52
℠
The information contained herein may not be copied, adapted or distributed and is not warranted to be accurate, complete or timely. The user assumes all risks for any damages or losses arising from any use of this information,
except to the extent such damages or losses cannot be limited or excluded by applicable law. Past financial performance is no guarantee of future results.