Hertz 2015 Annual Report Download - page 58
Download and view the complete annual report
Please find page 58 of the 2015 Hertz annual report below. You can navigate through the pages in the report by either clicking on the pages listed below, or by using the keyword search tool below to find specific information within the annual report.-
 1
1 -
2
-
3
-
4
-
5
-
6
-
7
-
8
-
9
-
10
-
11
-
12
-
13
-
14
-
15
-
16
-
17
-
18
-
19
-
20
-
21
-
22
-
23
-
24
-
25
-
26
-
27
-
28
-
29
-
30
-
31
-
32
-
33
-
34
-
35
-
36
-
37
-
38
-
39
-
40
-
41
-
42
-
43
-
44
-
45
-
46
-
47
-
 48
48 -
 49
49 -
 50
50 -
 51
51 -
 52
52 -
 53
53 -
 54
54 -
 55
55 -
 56
56 -
 57
57 -
 58
58 -
 59
59 -
 60
60 -
 61
61 -
 62
62 -
 63
63 -
 64
64 -
 65
65 -
 66
66 -
 67
67 -
 68
68 -
69
-
70
-
71
-
72
-
73
-
74
-
75
-
76
-
77
-
78
-
79
-
80
-
81
-
82
-
83
-
84
-
85
-
86
-
87
-
88
-
89
-
90
-
91
-
92
-
93
-
94
-
95
-
96
-
97
-
98
-
99
-
100
-
101
-
102
-
103
-
104
-
105
-
106
-
107
-
108
-
109
-
110
-
111
-
112
-
113
-
114
-
115
-
116
-
117
-
118
-
119
-
120
-
121
-
122
-
123
-
124
-
125
-
126
-
127
-
128
-
129
-
130
-
131
-
132
-
133
-
134
-
135
-
136
-
137
-
138
-
139
-
140
-
141
-
142
-
143
-
144
-
145
-
146
-
147
-
148
-
149
-
150
-
151
-
152
-
153
-
154
-
155
-
156
-
157
-
158
-
159
-
160
-
161
-
162
-
163
-
164
-
165
-
166
-
167
-
168
-
169
-
170
-
171
-
172
-
173
-
174
-
175
-
176
-
177
-
178
-
179
-
180
-
181
-
182
-
183
-
184
-
185
-
186
-
187
-
188
-
189
-
190
-
191
-
192
-
193
-
194
-
195
-
196
-
197
-
198
-
199
-
200
-
201
-
202
-
203
-
204
-
205
-
206
-
207
-
208
-
209
-
210
-
211
-
212
-
213
-
214
-
215
-
216
-
217
-
218
-
219
-
220
-
221
-
222
-
223
-
224
-
225
-
226
-
227
-
228
-
229
-
230
-
231
 |
 |

Table of Contents
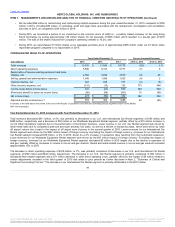
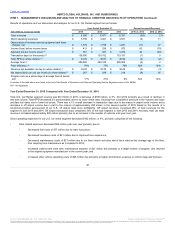
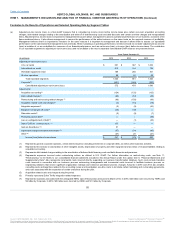
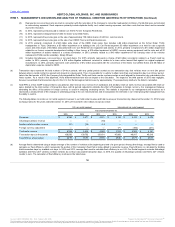
◦ Increased other vehicle operating costs of $24 million resulting from additional vehicle registration, taxes and stolen vehicles
expenses due to our business mix.
• Personnel related expenses increased $30 million, or 3%, from 2013, primarily driven by increases in field payroll wages and benefits. The
increases were driven by the off airport transaction growth in the insurance replacement business and the increased transportation of
vehicles in an effort to maximize fleet sharing initiatives between our brands as well as maintenance on a higher mileage fleet and
increased recalls.
• Other direct operating expenses increased $177 million, or 11%, from 2013 primarily comprised of:
◦ Increased facilities expense of $34 million primarily resulting from additional depreciation expense when compared with the prior
year due to an increase in the amount of capital expenditures on new and existing facilities;
◦ Increased restructuring costs of $46 million driven by our business transformation and integration initiatives;
◦ Increased field administration expenses of $33 million reflective of higher shared services operating expenses driven by our off
airport market expansion and employee relocation expenses related to the new headquarters in Florida;
◦ Increased customer service expenses of $29 million which was attributable to a change in contract terms with a certain service
provider during the year;
◦ Increased commissions of $33 million resulting from commission program rate changes and a shift of revenue mix to higher cost
commission reservation sources; and
◦ Increased computers and field systems expenses of $22 million driven by growth in the number of off airport transactions and
integration of our on airport field back-office and maintenance operations.
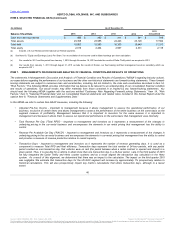
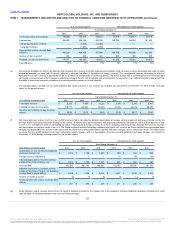
Depreciation of revenue earning equipment and lease charges, net increased $477 million, or 37%, from the prior year. Net depreciation per unit per
month for our U.S. Car Rental segment increased 35% to $294 from $218 year over year. This increase was primarily due to declining residual
values, a change in estimate of the channel shift benefit and a reduction in the planned hold period as we implemented our new fleet strategy.
Additionally, 2013 included $79 million of Dollar Thrifty acquisition accounting adjustments that reduced this expense.
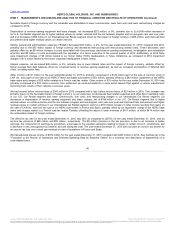
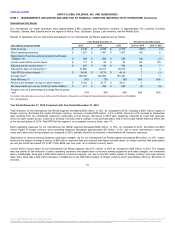
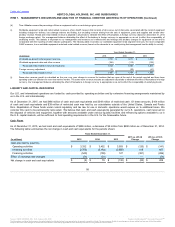
Income before income taxes decreased $614 million, or 70%, from the prior year. This decrease in income before income taxes was primarily due
to increased operating costs in the U.S. Car Rental segment due to damage, maintenance expenditures associated with higher mileage cars in the
fleet and increased personnel costs to support the higher mileage fleet, and increased net depreciation per unit per month of 35% to $294 from
$218 year over year. This increase was primarily due to declining residual values, a change in estimate of channel shift benefit and a reduction in
the planned hold period as we implemented our new fleet strategy. Additionally, 2013 depreciation expense was favorably impacted by $79 million
of Dollar Thrifty acquisition adjustments and an assumed longer fleet holding period. The change was partially offset by a $49 million decrease in
SG&A expenses resulting from reduced marketing, co-branding and promotional activity. Additionally, there was other income of $18 million in
2014 compared to other expense of $31 million in the prior year, resulting in a $49 million favorable impact. Other income in 2014 was primarily
comprised of a $19 million litigation settlement received in relation to a class action lawsuit filed against an original equipment manufacturer
stemming from recalls of their vehicles in previous years. Other expense in 2013 is primarily comprised of $40 million of impairment charges and
asset write-downs related to vehicles subleased to FSNA, the parent of Simply Wheelz, LLC, the owner and operator of our divested Advantage
brand, as further described in Note 3, "Acquisitions and Divestitures," to the Notes to our consolidated financial statements included in this Annual
Report under the caption Item 8, "Financial Statements and Supplementary Data."
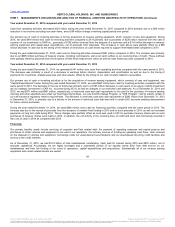
Adjusted pre-tax income decreased $646 million, or 63%, from the prior year. See footnote (a) in the "Footnotes to the Results of Operations and
Selected Operating Data by Segment Tables" for a summary and description of these adjustments on a consolidated basis.
50
℠
The information contained herein may not be copied, adapted or distributed and is not warranted to be accurate, complete or timely. The user assumes all risks for any damages or losses arising from any use of this information,
except to the extent such damages or losses cannot be limited or excluded by applicable law. Past financial performance is no guarantee of future results.