Hertz 2015 Annual Report Download - page 53
Download and view the complete annual report
Please find page 53 of the 2015 Hertz annual report below. You can navigate through the pages in the report by either clicking on the pages listed below, or by using the keyword search tool below to find specific information within the annual report.-
 1
1 -
2
-
3
-
4
-
5
-
6
-
7
-
8
-
9
-
10
-
11
-
12
-
13
-
14
-
15
-
16
-
17
-
18
-
19
-
20
-
21
-
22
-
23
-
24
-
25
-
26
-
27
-
28
-
29
-
30
-
31
-
32
-
33
-
34
-
35
-
36
-
37
-
38
-
39
-
40
-
41
-
42
-
 43
43 -
 44
44 -
 45
45 -
 46
46 -
 47
47 -
 48
48 -
 49
49 -
 50
50 -
 51
51 -
 52
52 -
 53
53 -
 54
54 -
 55
55 -
 56
56 -
 57
57 -
 58
58 -
 59
59 -
 60
60 -
 61
61 -
 62
62 -
 63
63 -
64
-
65
-
66
-
67
-
68
-
69
-
70
-
71
-
72
-
73
-
74
-
75
-
76
-
77
-
78
-
79
-
80
-
81
-
82
-
83
-
84
-
85
-
86
-
87
-
88
-
89
-
90
-
91
-
92
-
93
-
94
-
95
-
96
-
97
-
98
-
99
-
100
-
101
-
102
-
103
-
104
-
105
-
106
-
107
-
108
-
109
-
110
-
111
-
112
-
113
-
114
-
115
-
116
-
117
-
118
-
119
-
120
-
121
-
122
-
123
-
124
-
125
-
126
-
127
-
128
-
129
-
130
-
131
-
132
-
133
-
134
-
135
-
136
-
137
-
138
-
139
-
140
-
141
-
142
-
143
-
144
-
145
-
146
-
147
-
148
-
149
-
150
-
151
-
152
-
153
-
154
-
155
-
156
-
157
-
158
-
159
-
160
-
161
-
162
-
163
-
164
-
165
-
166
-
167
-
168
-
169
-
170
-
171
-
172
-
173
-
174
-
175
-
176
-
177
-
178
-
179
-
180
-
181
-
182
-
183
-
184
-
185
-
186
-
187
-
188
-
189
-
190
-
191
-
192
-
193
-
194
-
195
-
196
-
197
-
198
-
199
-
200
-
201
-
202
-
203
-
204
-
205
-
206
-
207
-
208
-
209
-
210
-
211
-
212
-
213
-
214
-
215
-
216
-
217
-
218
-
219
-
220
-
221
-
222
-
223
-
224
-
225
-
226
-
227
-
228
-
229
-
230
-
231
 |
 |

Table of Contents
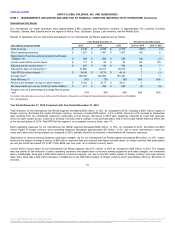
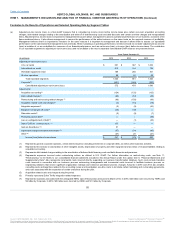
favorable impact of foreign currency and the remainder was attributable to lower commissions, lower fuel costs and lower restructuring charges as
compared to 2014.
Depreciation of revenue earning equipment and lease charges, net decreased $272 million, or 9%, primarily due to (i) a $186 million decrease in
our U.S. Car Rental segment due to higher residual values on certain vehicles and the mix between program and non-program cars year over year,
and (ii) a decrease of $94 million in our International Car Rental segment driven by the impact of foreign currency of $65 million, and improved fleet
procurement and higher residual values on certain vehicles.
Selling, general and administrative expenses (“SG&A”) decreased $43 million, or 4%, for the year ended December 31, 2015 compared with 2014,
primarily due to the $53 million impact of foreign currency and decreased restructuring and restructuring related costs. These decreases were
partially offset by an $8 million increase in costs associated with the previously disclosed accounting restatement, investigation and remediation
activities and $8 million in costs associated with the separation of a senior executive in the second quarter of 2015. Additionally, in 2015 there
were impairment charges of $6 million related to our former Dollar Thrifty headquarters in Tulsa, Oklahoma, as compared to 2014 impairment
charges of $13 million related to the former corporate headquarters in New Jersey.
Interest expense, net decreased $26 million, or 4%, primarily due to lower interest rates and the impact of foreign currency, partially offset by
higher average fleet debt balances driven by increased levels of revenue earning equipment, as well as increased amortization of deferred debt
costs, including waiver fees.
Other income of $131 million for the year ended December 31, 2015 is primarily comprised of a $133 million gain on the sale of common stock of
CAR Inc. and a gain on the sale of our HERC France and Spain businesses of $51 million, partially offset by a $40 million impairment of the HERC
trade name and charges of $23 million related to a French road tax matter. Other income of $15 million for the year ended December 31, 2014 was
primarily comprised of a $19 million economic loss settlement we received related to a class action lawsuit filed against a vehicle manufacturer
stemming from recalls of their vehicles in previous years.
We had income before income taxes of $341 million in 2015 compared with a loss before income taxes of $23 million in 2014. This increase was
primarily due to (i) the favorable impact of foreign currency on our expenses; (ii) decreased fleet related expenses and other direct operating costs
in our U.S. Car Rental segment and lower commissions, fuel costs and restructuring charges in our International Car Rental segment; (iii)
decreases in depreciation of revenue earning equipment and lease charges, net of $186 million in our U.S. Car Rental segment due to higher
residual values on certain vehicles and the mix between program and non-program cars year over year and improved fleet procurement and higher
residual values on certain vehicles in our International Car Rental segment; and (iv) a $116 million increase in other income resulting from gains on
the sale of CAR Inc. and from the sale of our HERC businesses in France and Spain, partially offset by an impairment charge of the HERC trade
name and charges related to a French road tax matter. Partially offsetting the above is lower revenues of $511 million, of which $414 million was
the unfavorable impact of foreign currency.
The effective tax rate for the year ended December 31, 2015 was 20% as compared to (257)% for the year ended December 31, 2014, with an
income tax provision of $68 million and $59 million, respectively. The $9 million increase in the tax provision is due to an increase in pretax
earnings, the composition of earnings by jurisdiction, a decrease in the valuation allowance relating to losses in certain non-U.S. jurisdictions, and
a decrease in net unrecognized tax benefits accrued during the year. The year ended December 31, 2015 also includes an income tax benefit for
an excess tax loss over a book gain realized on sale of operations in France and Spain.
We had adjusted pre-tax income of $572 million for the year ended December 31, 2015 compared with $403 million in 2014. See footnote (a) in the
"Footnotes to the Results of Operations and Selected Operating Data by Segment Tables" for a summary and description of adjustments on a
consolidated basis.
45
℠
The information contained herein may not be copied, adapted or distributed and is not warranted to be accurate, complete or timely. The user assumes all risks for any damages or losses arising from any use of this information,
except to the extent such damages or losses cannot be limited or excluded by applicable law. Past financial performance is no guarantee of future results.