Hertz 2015 Annual Report Download - page 68
Download and view the complete annual report
Please find page 68 of the 2015 Hertz annual report below. You can navigate through the pages in the report by either clicking on the pages listed below, or by using the keyword search tool below to find specific information within the annual report.-
 1
1 -
2
-
3
-
4
-
5
-
6
-
7
-
8
-
9
-
10
-
11
-
12
-
13
-
14
-
15
-
16
-
17
-
18
-
19
-
20
-
21
-
22
-
23
-
24
-
25
-
26
-
27
-
28
-
29
-
30
-
31
-
32
-
33
-
34
-
35
-
36
-
37
-
38
-
39
-
40
-
41
-
42
-
43
-
44
-
45
-
46
-
47
-
48
-
49
-
50
-
51
-
52
-
53
-
54
-
55
-
56
-
57
-
 58
58 -
 59
59 -
 60
60 -
 61
61 -
 62
62 -
 63
63 -
 64
64 -
 65
65 -
 66
66 -
 67
67 -
 68
68 -
 69
69 -
 70
70 -
 71
71 -
 72
72 -
 73
73 -
 74
74 -
 75
75 -
 76
76 -
 77
77 -
 78
78 -
79
-
80
-
81
-
82
-
83
-
84
-
85
-
86
-
87
-
88
-
89
-
90
-
91
-
92
-
93
-
94
-
95
-
96
-
97
-
98
-
99
-
100
-
101
-
102
-
103
-
104
-
105
-
106
-
107
-
108
-
109
-
110
-
111
-
112
-
113
-
114
-
115
-
116
-
117
-
118
-
119
-
120
-
121
-
122
-
123
-
124
-
125
-
126
-
127
-
128
-
129
-
130
-
131
-
132
-
133
-
134
-
135
-
136
-
137
-
138
-
139
-
140
-
141
-
142
-
143
-
144
-
145
-
146
-
147
-
148
-
149
-
150
-
151
-
152
-
153
-
154
-
155
-
156
-
157
-
158
-
159
-
160
-
161
-
162
-
163
-
164
-
165
-
166
-
167
-
168
-
169
-
170
-
171
-
172
-
173
-
174
-
175
-
176
-
177
-
178
-
179
-
180
-
181
-
182
-
183
-
184
-
185
-
186
-
187
-
188
-
189
-
190
-
191
-
192
-
193
-
194
-
195
-
196
-
197
-
198
-
199
-
200
-
201
-
202
-
203
-
204
-
205
-
206
-
207
-
208
-
209
-
210
-
211
-
212
-
213
-
214
-
215
-
216
-
217
-
218
-
219
-
220
-
221
-
222
-
223
-
224
-
225
-
226
-
227
-
228
-
229
-
230
-
231
 |
 |

Table of Contents
by special purpose entities, or are encumbered in favor of our lenders under our various credit facilities, other secured financings and asset-backed
securities programs. None of such assets (including the assets owned by each of Hertz Vehicle Financing II LP, HVF II GP Corp., Hertz Vehicle
Financing LLC, Rental Car Finance Corp., DNRS II LLC, Hertz Fleet Lease Funding LP, Donlen Trust and various international subsidiaries that
facilitate our international securitizations) are available to satisfy the claims of our general creditors. For further information on our indebtedness,
see Note 6, "Debt," to the Notes to our condensed consolidated financial statements included in this Report under the caption Item 8, "Financial
Statements and Supplementary Data".
Our liquidity as of December 31, 2015 consisted of cash and cash equivalents, unused commitments under our Senior ABL Facility and unused
commitments under our fleet debt, see "Borrowing Capacity and Availability" below. The Company’s practice is to maintain sufficient liquidity
through cash from operations, credit facilities and other financing arrangements, so that its operations are unaffected by adverse financial market
conditions.
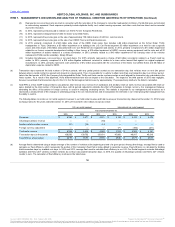
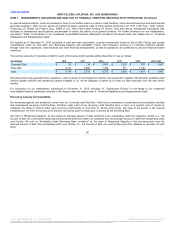
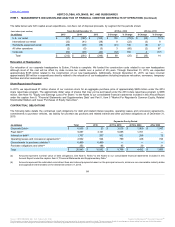
The nominal amounts of maturities of debt for each of the twelve-month periods ending December 31 are as follows:
Corporate Debt
$ 33
$ 34
$ 2,981
$ 1,257
$ 703
$ 1,047
Fleet Debt
3,101
3,699
1,356
571
1,130
—
Total
$ 3,134
$ 3,733
$ 4,337
$ 1,828
$ 1,833
$ 1,047
We believe that cash generated from operations, cash received on the disposal of vehicles and equipment, together with amounts available under
various liquidity facilities and refinancing options available to us, will be adequate to permit us to meet our debt maturities over the next twelve
months.
For information on our indebtedness subsequent to December 31, 2015, see Note 21, "Subsequent Events," to the Notes to our condensed
consolidated financial statements included in this Report under the caption Item 8, "Financial Statements and Supplementary Data."
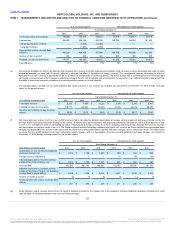
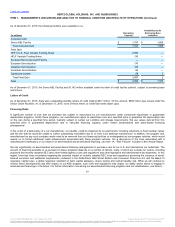
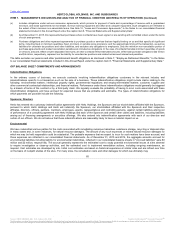
Our borrowing capacity and availability comes from our "revolving credit facilities," which are a combination of asset-backed securitization facilities
and asset-based revolving credit facilities. Creditors under each of our revolving credit facilities have a claim on a specific pool of assets as
collateral. Our ability to borrow under each revolving credit facility is a function of, among other things, the value of the assets in the relevant
collateral pool. We refer to the amount of debt we can borrow given a certain pool of assets as the borrowing base.
We refer to "Remaining Capacity" as the maximum principal amount of debt permitted to be outstanding under the respective facility (i.e., the
amount of debt we could borrow assuming we possessed sufficient assets as collateral) less the principal amount of debt then-outstanding under
such facility. We refer to "Availability Under Borrowing Base Limitation" as the lower of Remaining Capacity or the borrowing base less the
principal amount of debt then-outstanding under such facility (i.e., the amount of debt we could borrow given the collateral we possess at such
time).
60
℠
The information contained herein may not be copied, adapted or distributed and is not warranted to be accurate, complete or timely. The user assumes all risks for any damages or losses arising from any use of this information,
except to the extent such damages or losses cannot be limited or excluded by applicable law. Past financial performance is no guarantee of future results.