Frontier Airlines 2008 Annual Report Download - page 51
Download and view the complete annual report
Please find page 51 of the 2008 Frontier Airlines annual report below. You can navigate through the pages in the report by either clicking on the pages listed below, or by using the keyword search tool below to find specific information within the annual report.-
 1
1 -
2
-
3
-
4
-
5
-
6
-
7
-
8
-
9
-
10
-
11
-
12
-
13
-
14
-
15
-
16
-
17
-
18
-
19
-
20
-
21
-
22
-
23
-
24
-
25
-
26
-
27
-
28
-
29
-
30
-
31
-
32
-
33
-
34
-
35
-
36
-
37
-
38
-
39
-
40
-
 41
41 -
 42
42 -
 43
43 -
 44
44 -
 45
45 -
 46
46 -
 47
47 -
 48
48 -
 49
49 -
 50
50 -
 51
51 -
 52
52 -
 53
53 -
 54
54 -
 55
55 -
 56
56 -
 57
57 -
 58
58 -
 59
59 -
 60
60 -
 61
61 -
62
-
63
-
64
-
65
-
66
-
67
-
68
-
69
-
70
-
71
-
72
-
73
-
74
-
75
-
76
-
77
-
78
-
79
-
80
-
81
-
82
-
83
-
84
-
85
-
86
-
87
-
88
-
89
-
90
-
91
-
92
-
93
-
94
-
95
-
96
-
97
-
98
-
99
-
100
-
101
-
102
-
103
-
104
-
105
-
106
-
107
-
108
-
109
-
110
-
111
-
112
-
113
-
114
-
115
-
116
-
117
-
118
-
119
-
120
-
121
-
122
-
123
-
124
-
125
-
126
-
127
-
128
-
129
-
130
-
131
-
132
-
133
-
134
-
135
-
136
-
137
-
138
-
139
-
140
-
141
-
142
-
143
-
144
-
145
-
146
-
147
-
148
-
149
-
150
-
151
-
152
-
153
-
154
-
155
-
156
-
157
-
158
-
159
-
160
-
161
-
162
-
163
-
164
-
165
-
166
-
167
-
168
-
169
-
170
-
171
-
172
-
173
-
174
-
175
-
176
-
177
-
178
-
179
-
180
-
181
-
182
-
183
-
184
-
185
-
186
-
187
-
188
-
189
-
190
-
191
-
192
-
193
-
194
-
195
-
196
-
197
-
198
-
199
-
200
-
201
-
202
-
203
-
204
-
205
-
206
-
207
-
208
-
209
-
210
-
211
-
212
-
213
-
214
-
215
-
216
-
217
-
218
-
219
-
220
-
221
-
222
-
223
-
224
-
225
-
226
-
227
-
228
-
229
-
230
-
231
-
232
-
233
-
234
-
235
-
236
-
237
-
238
-
239
-
240
-
241
-
242
-
243
-
244
-
245
-
246
-
247
-
248
-
249
-
250
-
251
 |
 |

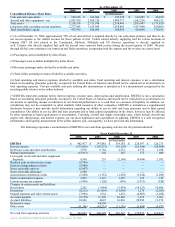
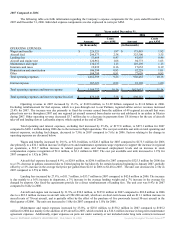
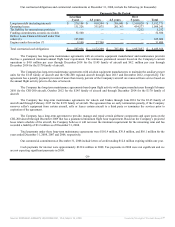
2007 Compared to 2006
The following table sets forth information regarding the Company’s expense components for the years ended December 31,
2007 and December 31, 2006. Individual expense components are also expressed in cents per ASM.
Years ended December 31,
2007 2006
Amount
Cents
per ASM Amount
Cents
per ASM
(in thousands) (in thousands)
OPERATING EXPENSES:
Wages and benefits $ 226,521 1.97 $ 175,483 1.92
Aircraft fuel 296,573 2.58 325,500 3.55
Landing fees 53,684 0.47 41,993 0.46
Aircraft and engine rent 124,961 1.08 94,773 1.03
Maintenance and repair 130,237 1.13 105,198 1.15
Insurance and taxes 19,039 0.16 17,652 0.19
Depreciation and amortization 106,594 0.93 92,228 1.01
Other 104,790 0.91 77,658 0.85
Total operating expenses 1,062,399 9.25 930,485 10.16
Interest expense 107,323 0.93 91,128 1.00
Total operating expenses and interest expense $ 1,169,722 10.16 $ 1,021,613 11.16
Total operating expenses and interest expense less fuel $ 873,149 7.58 $ 696,113 7.61
Operating revenue in 2007 increased by 13.1%, or $149.6 million, to $1.29 billion compared to $1.14 billion in 2006.
Excluding reimbursement for fuel expense, which is a pass-through cost to our Partners, regional airline service revenues increased
23.4% for 2007. The increase was due primarily to fixed-fee revenue earned from the addition of 49 regional jet aircraft that were
placed into service throughout 2007 and one regional jet aircraft removed from charter service and subleased to an airline in Mexico
during 2007. Other operating revenue decreased $3.7 million due to a decrease in payments from US Airways for the use of aircraft
take-off and landing slots at LaGuardia airport, which expired at the end of 2006.
Total operating and interest expenses, excluding fuel increased by 25.4%, or $177.0 million, to $873.1 million for 2007
compared to $696.1 million during 2006 due to the increase in flight operations. The cost per available seat mile on total operating and
interest expenses, excluding fuel charges, decreased to 7.58¢ in 2007 compared to 7.61¢ in 2006. Factors relating to the change in
operating expenses are discussed below.
Wages and benefits increased by 29.1%, or $51.0 million, to $226.5 million for 2007 compared to $175.5 million for 2006
due primarily to a $34.1 million increase in flight crew and maintenance operations wage expenses to support the increase in regional
jet operations, a $12.7 million increase in related payroll taxes and increased employment levels and an increase in stock
compensation expense recognition of $1.8 million, to $3.1 million in 2007. The cost per available seat mile increased to 1.97¢ for
2007 compared to 1.92¢ in 2006.
Aircraft fuel expense decreased 8.9%, or $28.9 million, to $296.6 million for 2007 compared to $325.5 million for 2006 due
to a 17% decrease in gallons consumed due to United paying for fuel directly for certain locations beginning in January 2007, partially
offset by a 11% increase in the average fuel price per gallon from $2.16 in 2006 to $2.40 in 2007. The unit cost decreased to 2.58¢ in
2007 compared to 3.55¢ in 2006.
Landing fees increased by 27.8%, or $11.7 million, to $53.7 million in 2007 compared to $42.0 million in 2006. The increase
is due mainly to a 16% increase in departures, a 3% increase in the average landing weight and a 7% increase in the average fee
charged by airports. Our fixed-fee agreements provide for a direct reimbursement of landing fees. The unit cost was 0.47¢ in 2007
compared to 0.46¢ in 2006.
Aircraft and engine rent increased by 31.9%, or $30.2 million, to $125.0 million in 2007 compared to $94.8 million in 2006
due to a $22.2 million increase in aircraft rents of CRJ-200 aircraft, which are on short-term leases and an $11.1 million increase in
aircraft rents of 70-seat aircraft, and is partially offset by the effect of the purchase of five previously leased 50-seat aircraft in the
third quarter of 2006. The unit cost increased to 1.08¢ for 2007 compared to 1.03¢ for 2006.
Maintenance and repair expenses increased by 23.8%, or $25.0 million, to $130.2 million in 2007 compared to $105.2
million for 2006 due mainly to the addition of 49 aircraft in 2007, which resulted in a $16.6 million increase in long-term maintenance
agreement expenses. Additionally, repair expenses on parts not under warranty or not included under long term contracts increased
Source: REPUBLIC AIRWAYS HOLDINGS INC, 10-K, March 16, 2009 Powered by Morningstar® Document Research℠