Frontier Airlines 2008 Annual Report Download - page 39
Download and view the complete annual report
Please find page 39 of the 2008 Frontier Airlines annual report below. You can navigate through the pages in the report by either clicking on the pages listed below, or by using the keyword search tool below to find specific information within the annual report.-
 1
1 -
2
-
3
-
4
-
5
-
6
-
7
-
8
-
9
-
10
-
11
-
12
-
13
-
14
-
15
-
16
-
17
-
18
-
19
-
20
-
21
-
22
-
23
-
24
-
25
-
26
-
27
-
28
-
 29
29 -
 30
30 -
 31
31 -
 32
32 -
 33
33 -
 34
34 -
 35
35 -
 36
36 -
 37
37 -
 38
38 -
 39
39 -
 40
40 -
 41
41 -
 42
42 -
 43
43 -
 44
44 -
 45
45 -
 46
46 -
 47
47 -
 48
48 -
 49
49 -
50
-
51
-
52
-
53
-
54
-
55
-
56
-
57
-
58
-
59
-
60
-
61
-
62
-
63
-
64
-
65
-
66
-
67
-
68
-
69
-
70
-
71
-
72
-
73
-
74
-
75
-
76
-
77
-
78
-
79
-
80
-
81
-
82
-
83
-
84
-
85
-
86
-
87
-
88
-
89
-
90
-
91
-
92
-
93
-
94
-
95
-
96
-
97
-
98
-
99
-
100
-
101
-
102
-
103
-
104
-
105
-
106
-
107
-
108
-
109
-
110
-
111
-
112
-
113
-
114
-
115
-
116
-
117
-
118
-
119
-
120
-
121
-
122
-
123
-
124
-
125
-
126
-
127
-
128
-
129
-
130
-
131
-
132
-
133
-
134
-
135
-
136
-
137
-
138
-
139
-
140
-
141
-
142
-
143
-
144
-
145
-
146
-
147
-
148
-
149
-
150
-
151
-
152
-
153
-
154
-
155
-
156
-
157
-
158
-
159
-
160
-
161
-
162
-
163
-
164
-
165
-
166
-
167
-
168
-
169
-
170
-
171
-
172
-
173
-
174
-
175
-
176
-
177
-
178
-
179
-
180
-
181
-
182
-
183
-
184
-
185
-
186
-
187
-
188
-
189
-
190
-
191
-
192
-
193
-
194
-
195
-
196
-
197
-
198
-
199
-
200
-
201
-
202
-
203
-
204
-
205
-
206
-
207
-
208
-
209
-
210
-
211
-
212
-
213
-
214
-
215
-
216
-
217
-
218
-
219
-
220
-
221
-
222
-
223
-
224
-
225
-
226
-
227
-
228
-
229
-
230
-
231
-
232
-
233
-
234
-
235
-
236
-
237
-
238
-
239
-
240
-
241
-
242
-
243
-
244
-
245
-
246
-
247
-
248
-
249
-
250
-
251
 |
 |

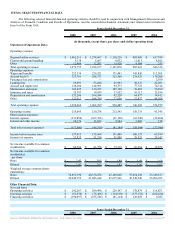
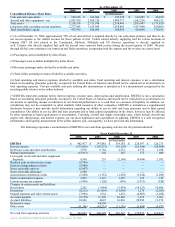
ITEM 6. SELECTED FINANCIAL DATA
The following selected financial data and operating statistics should be read in conjunction with Management's Discussion and
Analysis of Financial Condition and Results of Operations, and the consolidated financial statements and related notes included in
Item 8 of the Form 10-K.
Years Ended December 31,
2008 2007 2006 2005 2004
(in thousands, except share, per share and airline operating data)
Statement of Operations Data:
Operating revenues:
Regional airline services $ 1,462,211 $ 1,274,607 $ 1,118,226 $ 883,906 $ 637,389
Charter and ground handling 5,138 5,867 8,932 11,611 8,682
Other 12,406 12,203 15,920 9,504 253
Total operating revenues 1,479,755 1,292,677 1,143,078 905,021 646,324
Operating expenses:
Wages and benefits 252,336 226,521 175,483 143,826 112,305
Aircraft fuel (1) 327,791 296,573 325,500 278,923 174,208
Passenger fees and commissions — — — — 2,939
Landing fees 59,891 53,684 41,993 30,376 24,201
Aircraft and engine rent 134,206 124,961 94,773 77,725 74,514
Maintenance and repair 169,425 130,237 105,198 76,481 70,290
Insurance and taxes 25,793 19,039 17,652 16,117 13,186
Depreciation and amortization 133,206 106,594 92,228 64,877 34,412
Other 122,012 104,790 77,658 57,977 48,924
Total operating expenses 1,224,660 1,062,399 930,485 746,302 554,979
Operating income 255,095 230,278 212,593 158,719 91,345
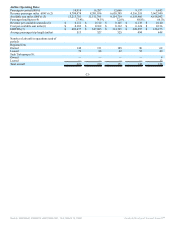
Other income (expense):
Interest expense (131,856) (107,323) (91,128) (63,546) (28,464)
Interest and other income 14,176 11,013 9,944 5,002 518
Total other income (expense) (117,680) (96,310) (81,184) (58,544) (27,946)
Income before income taxes 137,415 133,968 131,409 100,175 63,399
Income tax expense 52,835 51,210 51,899 39,521 24,547
Net income available for common
stockholders $ 84,580 $ 82,758 $ 79,510 $ 60,654 $ 38,852
Net income available for common
stockholders
per share:
Basic $ 2.43 $ 2.05 $ 1.89 $ 1.69 $ 1.66
Diluted $ 2.42 $ 2.02 $ 1.82 $ 1.66 $ 1.62
Weighted average common shares
outstanding:
Basic 34,855,190 40,350,256 42,149,668 35,854,249 23,349,613
Diluted 34,949,152 41,045,644 43,615,946 36,548,340 23,906,762
Other Financial Data:
Net cash from:
Operating activities $ 242,287 $ 280,490 $ 229,147 $ 170,879 $ 116,827
Investing activities $ (81,938) $ (76,468) $ (114,510) $ (175,152) $ (102,424)
Financing activities $ (194,697) $ (235,546) $ (81,114) $ 120,058 $ 9,282
Years Ended December 31,
2008 2007 2006 2005 2004
Source: REPUBLIC AIRWAYS HOLDINGS INC, 10-K, March 16, 2009 Powered by Morningstar® Document Research℠