Frontier Airlines 2008 Annual Report Download - page 40
Download and view the complete annual report
Please find page 40 of the 2008 Frontier Airlines annual report below. You can navigate through the pages in the report by either clicking on the pages listed below, or by using the keyword search tool below to find specific information within the annual report.-
 1
1 -
2
-
3
-
4
-
5
-
6
-
7
-
8
-
9
-
10
-
11
-
12
-
13
-
14
-
15
-
16
-
17
-
18
-
19
-
20
-
21
-
22
-
23
-
24
-
25
-
26
-
27
-
28
-
29
-
 30
30 -
 31
31 -
 32
32 -
 33
33 -
 34
34 -
 35
35 -
 36
36 -
 37
37 -
 38
38 -
 39
39 -
 40
40 -
 41
41 -
 42
42 -
 43
43 -
 44
44 -
 45
45 -
 46
46 -
 47
47 -
 48
48 -
 49
49 -
 50
50 -
51
-
52
-
53
-
54
-
55
-
56
-
57
-
58
-
59
-
60
-
61
-
62
-
63
-
64
-
65
-
66
-
67
-
68
-
69
-
70
-
71
-
72
-
73
-
74
-
75
-
76
-
77
-
78
-
79
-
80
-
81
-
82
-
83
-
84
-
85
-
86
-
87
-
88
-
89
-
90
-
91
-
92
-
93
-
94
-
95
-
96
-
97
-
98
-
99
-
100
-
101
-
102
-
103
-
104
-
105
-
106
-
107
-
108
-
109
-
110
-
111
-
112
-
113
-
114
-
115
-
116
-
117
-
118
-
119
-
120
-
121
-
122
-
123
-
124
-
125
-
126
-
127
-
128
-
129
-
130
-
131
-
132
-
133
-
134
-
135
-
136
-
137
-
138
-
139
-
140
-
141
-
142
-
143
-
144
-
145
-
146
-
147
-
148
-
149
-
150
-
151
-
152
-
153
-
154
-
155
-
156
-
157
-
158
-
159
-
160
-
161
-
162
-
163
-
164
-
165
-
166
-
167
-
168
-
169
-
170
-
171
-
172
-
173
-
174
-
175
-
176
-
177
-
178
-
179
-
180
-
181
-
182
-
183
-
184
-
185
-
186
-
187
-
188
-
189
-
190
-
191
-
192
-
193
-
194
-
195
-
196
-
197
-
198
-
199
-
200
-
201
-
202
-
203
-
204
-
205
-
206
-
207
-
208
-
209
-
210
-
211
-
212
-
213
-
214
-
215
-
216
-
217
-
218
-
219
-
220
-
221
-
222
-
223
-
224
-
225
-
226
-
227
-
228
-
229
-
230
-
231
-
232
-
233
-
234
-
235
-
236
-
237
-
238
-
239
-
240
-
241
-
242
-
243
-
244
-
245
-
246
-
247
-
248
-
249
-
250
-
251
 |
 |

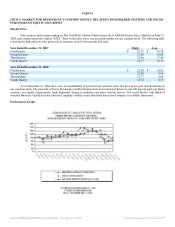
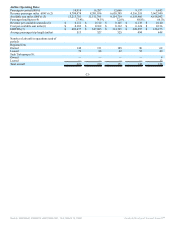
Airline Operating Data:
Passengers carried (000’s) 18,918 16,287 12,666 9,137 6,842
Revenue passenger miles (000’s) (2) 9,700,978 8,581,836 6,650,399 4,516,518 3,062,940
Available seat miles (000’s) (3) 13,213,701 11,511,795 9,154,719 6,559,966 4,618,042
Passenger load factor (4) 73.4% 74.5% 72.6% 68.8% 66.3%
Revenue per available seat mile (5) $ 0.112 $ 0.112 $ 0.125 $ 0.138 $ 0.140
Cost per available seat mile (6) $ 0.103 $ 0.102 $ 0.112 $ 0.124 $ 0.126
EBITDA (7) $ 402,477 $ 347,885 $ 314,765 $ 228,597 $ 126,275
Average passenger trip length (miles) 513 527 525 494 448
Number of aircraft in operations (end of
period):
Regional Jets:
Owned 142 131 109 90 62
Leased 79 88 62 52 49
Saab Turboprops (8):
Owned — — — — 4
Leased — — — — 13
Total aircraft 221 219 171 142 128
-21-
Source: REPUBLIC AIRWAYS HOLDINGS INC, 10-K, March 16, 2009 Powered by Morningstar® Document Research℠