Frontier Airlines 2008 Annual Report Download - page 41
Download and view the complete annual report
Please find page 41 of the 2008 Frontier Airlines annual report below. You can navigate through the pages in the report by either clicking on the pages listed below, or by using the keyword search tool below to find specific information within the annual report.-
 1
1 -
2
-
3
-
4
-
5
-
6
-
7
-
8
-
9
-
10
-
11
-
12
-
13
-
14
-
15
-
16
-
17
-
18
-
19
-
20
-
21
-
22
-
23
-
24
-
25
-
26
-
27
-
28
-
29
-
30
-
 31
31 -
 32
32 -
 33
33 -
 34
34 -
 35
35 -
 36
36 -
 37
37 -
 38
38 -
 39
39 -
 40
40 -
 41
41 -
 42
42 -
 43
43 -
 44
44 -
 45
45 -
 46
46 -
 47
47 -
 48
48 -
 49
49 -
 50
50 -
 51
51 -
52
-
53
-
54
-
55
-
56
-
57
-
58
-
59
-
60
-
61
-
62
-
63
-
64
-
65
-
66
-
67
-
68
-
69
-
70
-
71
-
72
-
73
-
74
-
75
-
76
-
77
-
78
-
79
-
80
-
81
-
82
-
83
-
84
-
85
-
86
-
87
-
88
-
89
-
90
-
91
-
92
-
93
-
94
-
95
-
96
-
97
-
98
-
99
-
100
-
101
-
102
-
103
-
104
-
105
-
106
-
107
-
108
-
109
-
110
-
111
-
112
-
113
-
114
-
115
-
116
-
117
-
118
-
119
-
120
-
121
-
122
-
123
-
124
-
125
-
126
-
127
-
128
-
129
-
130
-
131
-
132
-
133
-
134
-
135
-
136
-
137
-
138
-
139
-
140
-
141
-
142
-
143
-
144
-
145
-
146
-
147
-
148
-
149
-
150
-
151
-
152
-
153
-
154
-
155
-
156
-
157
-
158
-
159
-
160
-
161
-
162
-
163
-
164
-
165
-
166
-
167
-
168
-
169
-
170
-
171
-
172
-
173
-
174
-
175
-
176
-
177
-
178
-
179
-
180
-
181
-
182
-
183
-
184
-
185
-
186
-
187
-
188
-
189
-
190
-
191
-
192
-
193
-
194
-
195
-
196
-
197
-
198
-
199
-
200
-
201
-
202
-
203
-
204
-
205
-
206
-
207
-
208
-
209
-
210
-
211
-
212
-
213
-
214
-
215
-
216
-
217
-
218
-
219
-
220
-
221
-
222
-
223
-
224
-
225
-
226
-
227
-
228
-
229
-
230
-
231
-
232
-
233
-
234
-
235
-
236
-
237
-
238
-
239
-
240
-
241
-
242
-
243
-
244
-
245
-
246
-
247
-
248
-
249
-
250
-
251
 |
 |

As of December 31,
2008 2007 2006 2005 2004
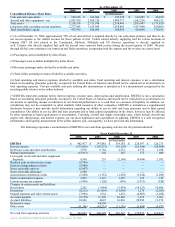
Consolidated Balance Sheet Data: (in thousands)
Cash and cash equivalents $ 129,656 $ 164,004 $ 195,528 $ 162,005 $ 46,220
Aircraft and other equipment—net 2,692,410 2,308,726 1,889,717 1,662,236 984,512
Total assets 3,236,578 2,773,078 2,358,441 2,035,947 1,171,820
Long-term debt, including current maturities 2,277,845 1,913,580 1,568,803 1,413,440 850,869
Total stockholders' equity 475,939 426,086 508,829 424,698 174,651
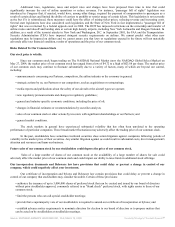
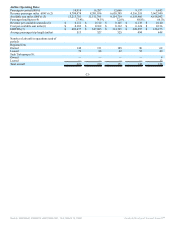
(1) As of December 31, 2008, approximately 70% of our aircraft fuel is supplied directly by our code-share partners, and thus we do
not record expense or the related revenue for those gallons of fuel. United started directly supplying fuel for certain locations in
January 2007. All fuel related to the Continental, Midwest, Mokulele and US Airways operations is directly supplied as
well. Frontier also directly supplied fuel until the aircraft were removed from service during the second quarter of 2008. We pass
through all fuel costs relating to our American and Delta operations, recognizing both the expense and the revenue on a gross basis.
(2) Passengers carried multiplied by miles flown.
(3) Passenger seats available multiplied by miles flown.
(4) Revenue passenger miles divided by available seat miles.
(5) Total airline operating revenues divided by available seat miles.
(6) Total operating and interest expenses divided by available seat miles. Total operating and interest expenses is not a calculation
based on accounting principles generally accepted in the United States of America and should not be considered as an alternative to
total operating expenses. Cost per available seat mile utilizing this measurement is included as it is a measurement recognized by the
investing public relative to the airline industry.
(7) EBITDA represents earnings before interest expense, income taxes, depreciation and amortization. EBITDA is not a calculation
based on accounting principles generally accepted in the United States of America and should not be considered as an alternative to
net income or operating income as indicators of our financial performance or to cash flow as a measure of liquidity. In addition, our
calculations may not be comparable to other similarly titled measures of other companies. EBITDA is included as a supplemental
disclosure because it may provide useful information regarding our ability to service debt and lease payments and to fund capital
expenditures. Our ability to service debt and lease payments and to fund capital expenditures in the future, however, may be affected
by other operating or legal requirements or uncertainties. Currently, aircraft and engine ownership costs, which include aircraft and
engine rent, depreciation, and interest expense, are our most significant cash expenditure. In addition, EBITDA is a well recognized
performance and liquidity measurement in the airline industry and, consequently, we have provided this information.
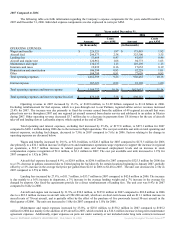
The following represents a reconciliation of EBITDA to net cash from operating activities for the periods indicated:
Years Ended December 31,
2008 2007 2006 2005 2004
(in thousands)
EBITDA $ 402,477 $ 347,885 $ 314,765 $ 228,597 $ 126,275
Interest expense (131,856) (107,323) (91,128) (63,546) (28,464)
Debt issue costs and other amortization 7,078 6,764 4,551 2,776 1,928
Warrant amortization (15,953) 102 565 372 800
Loss (gain) on aircraft and other equipment
disposals 4,749 255 (2,168) (4,494) 2,592
Realized gain on interest rate swaps (5,785) — — — —
Gain on extinguishment of debt (5,980) — — — —
Notes receivable interest (1,087) — — — —
Notes receivable allowance 1,500 — — — —
Amortization of deferred credits (1,960) (1,761) (1,438) (1,346) (1,285)
Stock compensation expense 3,925 3,119 1,297 125 214
Current income tax expense (3,496) (120) (495) (1,915) (520)
Changes in certain assets and liabilities:
Receivables 2,281 (7,944) (2,939) (10,323) 10,480
Inventories (8,212) (11,419) (11,448) 1,276 (2,683)
Prepaid expenses and other current assets (7,996) 1,554 1,474 (4,907) (1,022)
Accounts payable (2,158) 11,299 10,546 1,152 1,963
Accrued liabilities 16,006 4,022 16,826 28,980 11,370
Deferred revenue — 44,590 — — —
Other assets (11,246) (10,533) (11,261) (5,868) (4,821)
Net cash from operating activities $ 242,287 $ 280,490 $ 229,147 $ 170,879 $ 116,827
Source: REPUBLIC AIRWAYS HOLDINGS INC, 10-K, March 16, 2009 Powered by Morningstar® Document Research℠