Frontier Airlines 2008 Annual Report Download - page 47
Download and view the complete annual report
Please find page 47 of the 2008 Frontier Airlines annual report below. You can navigate through the pages in the report by either clicking on the pages listed below, or by using the keyword search tool below to find specific information within the annual report.-
 1
1 -
2
-
3
-
4
-
5
-
6
-
7
-
8
-
9
-
10
-
11
-
12
-
13
-
14
-
15
-
16
-
17
-
18
-
19
-
20
-
21
-
22
-
23
-
24
-
25
-
26
-
27
-
28
-
29
-
30
-
31
-
32
-
33
-
34
-
35
-
36
-
 37
37 -
 38
38 -
 39
39 -
 40
40 -
 41
41 -
 42
42 -
 43
43 -
 44
44 -
 45
45 -
 46
46 -
 47
47 -
 48
48 -
 49
49 -
 50
50 -
 51
51 -
 52
52 -
 53
53 -
 54
54 -
 55
55 -
 56
56 -
 57
57 -
58
-
59
-
60
-
61
-
62
-
63
-
64
-
65
-
66
-
67
-
68
-
69
-
70
-
71
-
72
-
73
-
74
-
75
-
76
-
77
-
78
-
79
-
80
-
81
-
82
-
83
-
84
-
85
-
86
-
87
-
88
-
89
-
90
-
91
-
92
-
93
-
94
-
95
-
96
-
97
-
98
-
99
-
100
-
101
-
102
-
103
-
104
-
105
-
106
-
107
-
108
-
109
-
110
-
111
-
112
-
113
-
114
-
115
-
116
-
117
-
118
-
119
-
120
-
121
-
122
-
123
-
124
-
125
-
126
-
127
-
128
-
129
-
130
-
131
-
132
-
133
-
134
-
135
-
136
-
137
-
138
-
139
-
140
-
141
-
142
-
143
-
144
-
145
-
146
-
147
-
148
-
149
-
150
-
151
-
152
-
153
-
154
-
155
-
156
-
157
-
158
-
159
-
160
-
161
-
162
-
163
-
164
-
165
-
166
-
167
-
168
-
169
-
170
-
171
-
172
-
173
-
174
-
175
-
176
-
177
-
178
-
179
-
180
-
181
-
182
-
183
-
184
-
185
-
186
-
187
-
188
-
189
-
190
-
191
-
192
-
193
-
194
-
195
-
196
-
197
-
198
-
199
-
200
-
201
-
202
-
203
-
204
-
205
-
206
-
207
-
208
-
209
-
210
-
211
-
212
-
213
-
214
-
215
-
216
-
217
-
218
-
219
-
220
-
221
-
222
-
223
-
224
-
225
-
226
-
227
-
228
-
229
-
230
-
231
-
232
-
233
-
234
-
235
-
236
-
237
-
238
-
239
-
240
-
241
-
242
-
243
-
244
-
245
-
246
-
247
-
248
-
249
-
250
-
251
 |
 |

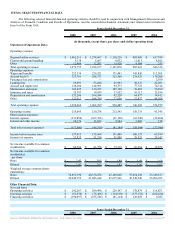
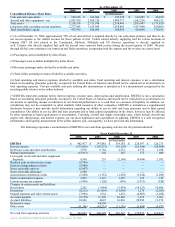
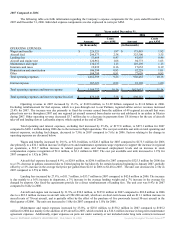
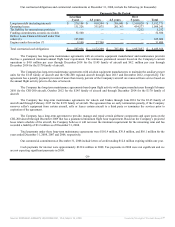
Certain Statistical Information
Years Ended December 31,
Operating Expenses per ASM in cents
2008 2007 2006
OPERATING EXPENSES
Wages and benefits 1.91 1.97 1.92
Aircraft fuel (1) 2.48 2.58 3.55
Landing fees 0.45 0.47 0.46
Aircraft and engine rent 1.02 1.08 1.03
Maintenance and repair 1.28 1.13 1.15
Insurance and taxes 0.20 0.16 0.19
Depreciation and amortization 1.01 0.93 1.01
Other 0.92 0.91 0.85
Total operating expenses 9.27 9.23 10.16
Plus interest expense 1.00 0.93 1.00
Total operating and interest expenses 10.27 10.16 11.16
Total operating and interest expenses excluding aircraft fuel 7.79 7.58 7.61
(1) As of December 31, 2008, approximately 70% of our aircraft fuel is supplied directly by our code-share partners, and thus we do
not record expense or the related revenue for those gallons of fuel. United started directly supplying fuel for certain locations in
January 2007. All fuel related to the Continental, Frontier, Midwest, Mokulele and US Airways operations is directly supplied as
well. We pass through all fuel costs relating to our American and Delta operations, recognizing both the expense and the revenue on a
gross basis.
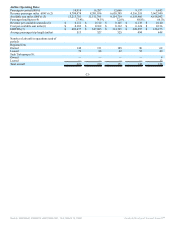
Years Ended December 31,
2008
Increase/
(Decrease)
2008-2007
2007
Increase/
(Decrease)
2007-2006
2006
Passengers carried (000’s) 18,918 16.2% 16,287 28.6% 12,666
Revenue passenger miles (000’s) (1) 9,700,978 13.0% 8,581,836 29.0% 6,650,399
Available seat miles (000’s) (2) 13,213,701 14.8% 11,511,795 25.7% 9,154,719
Passenger load factor (3) 73.4% (1.1pp) 74.5% 1.9pp 72.6%
Cost per available seat mile (4) 10.27¢ 1.1% 10.16¢ (9.0%) 11.16¢
Average price per gallon of fuel (5) $3.21 33.8% $2.40 11.1% $2.16
Fuel gallons consumed (6) 101,998,657 (17.4%) 123,438,728 (17.4%) 149,383,949
Block hours (7) 740,403 8.9% 679,718 22.1% 556,635
Average passenger trip length (miles) 513 (2.7%) 527 0.4% 525
Average daily utilization of each aircraft
(hours) (8)
10.03
(2.8%)
10.32 (0.3%) 10.35
Aircraft in operations at end of period 221 0.9% 219 28.1% 171
(1) Passengers carried multiplied by miles flown.
(2) Passenger seats available multiplied by miles flown.
(3) Revenue passenger miles divided by available seat miles.
(4) Total operating and interest expenses divided by available seat miles.
(5) Cost of aircraft fuel, including fuel taxes and into-plane fees.
(6) As of December 31, 2008, approximately 70% of our aircraft fuel is supplied directly by our code-share partners, and thus we do
not record expense or the related revenue for those gallons of fuel. United started directly supplying fuel for certain locations in
January 2007. All fuel related to the Continental, Midwest, Mokulele and US Airways operations is directly supplied as
well. Frontier also directly supplied fuel until the aircraft were removed from service during the second quarter of 2008. We pass
through all fuel costs relating to our American and Delta operations, recognizing both the expense and the revenue on a gross basis.
(7) Hours from takeoff to landing, including taxi time.
(8) Average number of hours per day that an aircraft flown in revenue service is operated (from gate departure to gate arrival).
Source: REPUBLIC AIRWAYS HOLDINGS INC, 10-K, March 16, 2009 Powered by Morningstar® Document Research℠