Duke Energy 2006 Annual Report Download - page 34
Download and view the complete annual report
Please find page 34 of the 2006 Duke Energy annual report below. You can navigate through the pages in the report by either clicking on the pages listed below, or by using the keyword search tool below to find specific information within the annual report.-
 1
1 -
2
-
3
-
4
-
5
-
6
-
7
-
8
-
9
-
10
-
11
-
12
-
13
-
14
-
15
-
16
-
17
-
18
-
19
-
20
-
21
-
22
-
23
-
 24
24 -
 25
25 -
 26
26 -
 27
27 -
 28
28 -
 29
29 -
 30
30 -
 31
31 -
 32
32 -
 33
33 -
 34
34 -
 35
35 -
 36
36 -
 37
37 -
 38
38 -
 39
39 -
 40
40 -
 41
41 -
 42
42 -
 43
43 -
 44
44
 |
 |

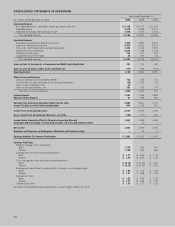
CONSOLIDATED STATEMENTS OF CASH FLOWS
32
Years Ended December 31,
(In millions) 2006 2005 2004
CASH FLOWS FROM OPERATING ACTIVITIES
Net income $ 1,863 $ 1,824 $ 1,490
Adjustments to reconcile net income to net cash provided by operating activities:
Depreciation and amortization (including amortization of nuclear fuel) 2,215 1,884 2,037
Cumulative effect of change in accounting principle — 4 —
Gains on sales of investments in commercial and multi-family real estate (201) (191) (201)
Gains on sales of equity investments and other assets (365) (1,771) (193)
Impairment charges 48 159 194
Deferred income taxes 250 282 867
Minority Interest 61 538 195
Equity in earnings of unconsolidated affiliates (732) (479) (161)
Purchased capacity levelization (14) (14) 92
Contributions to company-sponsored pension plans (172) (45) (279)
(Increase) decrease in
Net realized and unrealized mark-to-market and hedging transactions (134) 443 216
Receivables 844 (249) (231)
Inventory (24) (80) (48)
Other current assets 1,276 (944) (33)
Increase (decrease) in
Accounts payable (1,524) 117 (5)
Taxes accrued (69) 53 188
Other current liabilities (594) 622 91
Capital expenditures for residential real estate (322) (355) (322)
Cost of residential real estate sold 143 294 268
Other, assets 1,005 193 (155)
Other, liabilities 194 533 158
Net cash provided by operating activities 3,748 2,818 4,168
CASH FLOWS FROM INVESTING ACTIVITIES
Capital expenditures (3,381) (2,327) (2,161)
Investment expenditures (89) (43) (46)
Acquisitions, net of cash acquired (284) (294) —
Cash acquired from acquisition of Cinergy 147 — —
Purchases of available-for-sale securities (33,436) (40,317) (65,929)
Proceeds from sales and maturities of available-for-sale securities 32,596 40,131 65,098
Net proceeds from the sales of equity investments and other assets,
and sales of and collections on notes receivable 2,861 2,375 1,619
Proceeds from the sales of commercial and multi-family real estate 254 372 606
Settlement of net investment hedges and other investing derivatives (163) (296) —
Distributions from equity investments 152 383 —
Purchases of emission allowances (228) (18) —
Sales of emission allowances 194 — —
Other 49 (92) 20
Net cash used in investing activities (1,328) (126) (793)
CASH FLOWS FROM FINANCING ACTIVITIES
Proceeds from the:
Issuance of long-term debt 2,369 543 153
Issuance of common stock and common stock related to employee benefit plans 127 41 1,704
Payments for the redemption of:
Long-term debt (2,098) (1,346) (3,646)
Preferred stock of a subsidiary (12) (134) (176)
Decrease in cash overdrafts (2) — —
Notes payable and commercial paper (412) 165 (67)
Distributions to minority interests (304) (861) (1,477)
Contributions from minority interests 247 779 1,277
Dividends paid (1,488) (1,105) (1,065)
Repurchase of common shares (500) (933) —
Proceeds from Duke Energy Income Fund 104 110 —
Other 8 24 19
Net cash used in financing activities (1,961) (2,717) (3,278)
Changes in cash and cash equivalents included in assets held for sale (22) 3 39
Net increase (decrease) in cash and cash equivalents 437 (22) 136
Cash and cash equivalents at beginning of period 511 533 397
Cash and cash equivalents at end of period $ 948 $ 511 $ 533
Supplemental Disclosures
Cash paid for interest, net of amount capitalized $ 1,154 $ 1,089 $ 1,323
Cash paid (refunded) for income taxes $ 460 $ 546 $ (339)
Acquisition of Cinergy Corp.
Fair value of assets acquired $ 17,304 $ — $ —
Liabilities assumed $ 12,709 $ — $ —
Issuance of common stock $ 8,993 $ — $ —
Significant non-cash transactions:
Conversion of convertible notes to stock $ 632 $ 28 $ —
AFUDC-equity component $ 58 $ 30 $ 25
Transfer of DEFS Canadian Facilities $ — $ 97 $ —
Debt retired in connection with disposition of business $ — $ — $ 840
Note receivable from sale of southeastern plants $ — $ — $ 48
Remarketing of senior notes $ — $ — $ 1,625
See Notes to Consolidated Financial Statements in Duke Energy’s 2006 Form 10-K.