Bed, Bath and Beyond 2004 Annual Report Download - page 7
Download and view the complete annual report
Please find page 7 of the 2004 Bed, Bath and Beyond annual report below. You can navigate through the pages in the report by either clicking on the pages listed below, or by using the keyword search tool below to find specific information within the annual report.-
 1
1 -
 2
2 -
 3
3 -
 4
4 -
 5
5 -
 6
6 -
 7
7 -
 8
8 -
 9
9 -
 10
10 -
 11
11 -
 12
12 -
 13
13 -
 14
14 -
 15
15 -
 16
16 -
 17
17 -
 18
18 -
19
-
20
-
21
-
22
-
23
-
24
-
25
-
26
-
27
-
28
-
29
-
30
-
31
-
32
 |
 |

BED BATH & BEYOND ANNUAL REPORT 2004
5
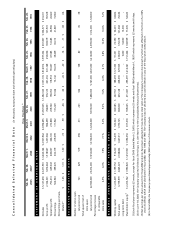
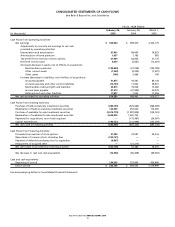
Selling, general and administrative expenses
Selling, general and administrative expenses (“SG&A”) were $1.394 billion or 27.1% of net sales in fiscal 2004
compared to $1.237 billion or 27.6% of net sales in fiscal 2003. The decrease in SG&A as a percentage of net sales
primarily reflects a relative decrease in payroll and payroll related items, occupancy costs and other expenses, which
primarily resulted from the comparable store sales increase. The above relative decreases were partially offset by a
relative increase in net advertising costs.
SG&A as a percentage of net sales decreased to 27.6% in fiscal 2003 from 28.3% in fiscal 2002 primarily as a result of
a relative decrease in occupancy costs, other store expenses and costs associated with new store openings, partially
offset by a relative increase in litigation expense and net advertising costs. SG&A in fiscal 2003 was $1.237 billion as
compared to $1.038 billion in fiscal 2002.
Operating Profit
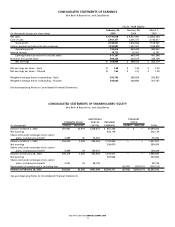
Operating profit increased to $792.4 million in fiscal 2004 compared to $639.3 million in fiscal 2003. The improve-
ments in operating profit were a result of the increase in net sales and a relative increase in gross profit as a percent-
age of net sales and a relative decrease in SG&A as a percentage of net sales, as discussed above.
Interest income
Interest income increased to $18.8 million in fiscal 2004 compared to $10.2 million in fiscal 2003 due to an increase in
the cash invested and an increase in the Company’s average investment interest rate as a result of the recent upward
trend in short term interest rates. Interest income decreased in fiscal 2003 from $11.3 million in fiscal 2002 due to the
decrease in the average investment interest rate partially offset by an increase in the cash invested.
Income taxes
The effective tax rate was 37.75% for fiscal 2004 and 38.50% for fiscal 2003 and 2002. The decrease is due to a reduc-
tion in the weighted average effective tax rate resulting from a change in the mix of the business within the taxable
jurisdictions in which the Company operates.
EXPANSION PROGRAM
The Company is engaged in an ongoing expansion program involving the opening of new stores in both new and
existing markets and the expansion or relocation of existing stores. In the thirteen year period from the beginning of
fiscal 1992 to the end of fiscal 2004, the chain has grown from 34 to 660 BBB stores. Total BBB stores’ square footage
grew from 917,000 square feet at the beginning of fiscal 1992 to 21,691,000 square feet at the end of fiscal 2004.
There were 35 Harmon stores with 240,000 square feet and 26 CTS stores with 1,014,000 square feet at the end of
fiscal 2004.
The Company intends to continue its expansion program and currently plans to open new BBB, Harmon and CTS
stores in fiscal 2005 (see details under “Liquidity and Capital Resources” below). The Company believes that a
predominant portion of any increase in its net sales in fiscal 2005 will continue to be attributable to new store net
sales. Accordingly, the continued growth of the Company is dependent, in large part, upon the Company’s ability
to execute its expansion program successfully, of which there can be no assurance.
LIQUIDITY AND CAPITAL RESOURCES
The Company has been able to finance its operations, including its expansion program, through internally generated
funds. Net cash provided by operating activities in fiscal 2004 was $616.4 million, compared with $548.4 million in
fiscal 2003. The increase in net cash provided by operating activities was primarily attributable to an increase in net
income and the timing of certain liability payments, partially offset by an increase in merchandise inventories
(primarily the result of new store space) and the reduction of the tax benefit from the exercise of stock options.
Inventory per square foot was $50.21 as of February 26, 2005 and $49.45 as of February 28, 2004. The Company
continues to focus on optimizing inventory productivity while maintaining appropriate in-store merchandise levels
to support sales growth.