Bed, Bath and Beyond 2004 Annual Report Download - page 6
Download and view the complete annual report
Please find page 6 of the 2004 Bed, Bath and Beyond annual report below. You can navigate through the pages in the report by either clicking on the pages listed below, or by using the keyword search tool below to find specific information within the annual report.-
 1
1 -
 2
2 -
 3
3 -
 4
4 -
 5
5 -
 6
6 -
 7
7 -
 8
8 -
 9
9 -
 10
10 -
 11
11 -
 12
12 -
 13
13 -
 14
14 -
 15
15 -
 16
16 -
 17
17 -
18
-
19
-
20
-
21
-
22
-
23
-
24
-
25
-
26
-
27
-
28
-
29
-
30
-
31
-
32
 |
 |

BED BATH & BEYOND ANNUAL REPORT 2004
4
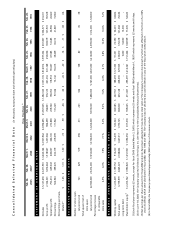
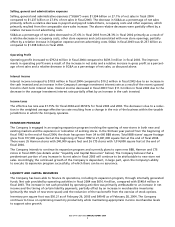
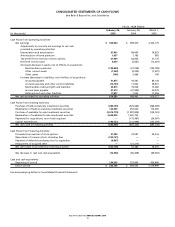
RESULTS OF OPERATIONS
The following table sets forth for the periods indicated (i) selected statement of earnings data of the Company
expressed as a percentage of net sales and (ii) the percentage change in dollar amounts from the prior year in select-
ed statement of earnings data:
Fiscal Year Ended
Percentage Percentage Change
of Net Sales from Prior Year
February 26, February 28, March 1, February 26, February 28,
2005 2004 2003 2005 2004
Net sales 100.0% 100.0% 100.0% 15.0% 22.2%
Cost of sales 57.5 58.1 58.6 13.8 21.2
Gross profit 42.5 41.9 41.4 16.5 23.6
Selling, general and administrative expenses 27.1 27.6 28.3 12.7 19.1
Operating profit 15.4 14.3 13.1 23.9 33.2
Earnings before provision for income taxes 15.8 14.5 13.4 24.9 32.2
Net earnings 9.8 8.9 8.2 26.4 32.2
Net Sales
Net sales in fiscal 2004 increased $669.7 million to $5.148 billion, representing an increase of 15.0% over the $4.478
billion of net sales in fiscal 2003, which increased $812.8 million or 22.2% over net sales of $3.665 billion in fiscal
2002. Approximately 56% of the increase in fiscal 2004 was attributable to an increase in the Company’s new store
sales, approximately 15% of the increase was attributable to the net sales of CTS (acquired on June 19, 2003) and the
balance of the increase was primarily attributable to the increase in comparable store sales. The increase in compara-
ble store sales for fiscal 2004 of 4.5% was due to a number of factors, including but not limited to, the continued
consumer acceptance of the Company’s merchandise offerings and a strong focus on customer service with an
emphasis on responding to customer feedback. For fiscal 2003, approximately 41% of the increase in net sales was
attributable to an increase in BBB’s new store sales, approximately 34% of the increase was attributable to the net
sales of CTS and the balance of the increase was primarily attributable to the increase in comparable store sales.
Sales of domestics merchandise accounted for approximately 48%, 51% and 55% of net sales in fiscal 2004, 2003 and
2002, respectively, of which the Company estimates that bed linens accounted for approximately 17%, 16% and 19%
of net sales in fiscal 2004, 2003 and 2002, respectively. The remaining net sales in fiscal 2004, 2003 and 2002 of 52%,
49% and 45%, respectively, represented sales of home furnishings. The change in the product mix between fiscal
2004 and 2003 and between fiscal 2003 and 2002 is primarily the result of the acquisition of CTS in June 2003. No
other individual product category accounted for 10% or more of net sales during fiscal 2004, 2003 or 2002.
Gross Profit
Gross profit in fiscal 2004, 2003 and 2002 was $2.186 billion or 42.5% of net sales, $1.877 billion or 41.9% of net sales
and $1.519 billion or 41.4% of net sales, respectively. The increase in gross profit between fiscal 2004 and 2003 as a
percentage of net sales was primarily attributable to the reduction of inventory acquisition costs of the Company’s
current merchandise offerings. The increase in gross profit between fiscal 2003 and 2002 as a percentage of net sales
was primarily attributable to improvements in both the markup and in markdowns taken.
MANAGEMENT’S DISCUSSION AND ANALYSIS OF FINANCIAL CONDITION AND RESULTS OF OPERATIONS
(continued)