Bed, Bath and Beyond 2002 Annual Report Download - page 9
Download and view the complete annual report
Please find page 9 of the 2002 Bed, Bath and Beyond annual report below. You can navigate through the pages in the report by either clicking on the pages listed below, or by using the keyword search tool below to find specific information within the annual report.-
 1
1 -
 2
2 -
 3
3 -
 4
4 -
 5
5 -
 6
6 -
 7
7 -
 8
8 -
 9
9 -
 10
10 -
 11
11 -
 12
12 -
 13
13 -
 14
14 -
 15
15 -
 16
16 -
 17
17 -
 18
18 -
 19
19 -
 20
20 -
21
 |
 |

BED BATH & BEYOND ANNUAL REPORT 2002
7
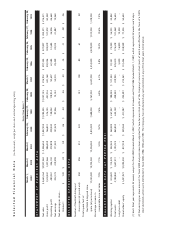
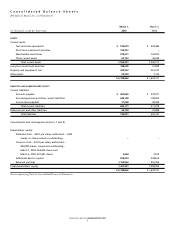
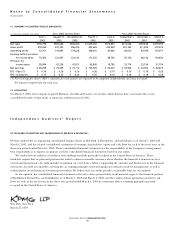
Consolidated Balance Sheets
Bed Bath & Beyond Inc. and Subsidiaries
March 1, March 2,
(in thousands, except per share data) 2003 2002
ASSETS
Current assets:
Cash and cash equivalents $ 515,670 $ 429,496
Short term investment securities 100,927 –
Merchandise inventories 915,671 753,972
Other current assets 62,123 43,249
Total current assets 1,594,391 1,226,717
Long term investment securities 148,005 51,909
Property and equipment, net 423,907 361,741
Other assets 22,539 7,150
$ 2,188,842 $ 1,647,517
LIABILITIES AND SHAREHOLDERS' EQUITY
Current liabilities:
Accounts payable $ 362,965 $ 270,917
Accrued expenses and other current liabilities 246,198 190,923
Income taxes payable 71,008 49,438
Total current liabilities 680,171 511,278
Deferred rent and other liabilities 56,750 41,889
Total liabilities 736,921 553,167
Commitments and contingencies (notes 3, 7 and 9)
Shareholders' equity:
Preferred stock – $0.01 par value; authorized – 1,000
shares; no shares issued or outstanding ––
Common stock – $0.01 par value; authorized –
900,000 shares; issued and outstanding –
March 1, 2003, 294,430 shares and
March 2, 2002, 291,441 shares 2,944 2,914
Additional paid–in capital 294,034 238,672
Retained earnings 1,154,943 852,764
Total shareholders' equity 1,451,921 1,094,350
$ 2,188,842 $ 1,647,517
See accompanying Notes to Consolidated Financial Statements.