Bed, Bath and Beyond 2002 Annual Report Download - page 11
Download and view the complete annual report
Please find page 11 of the 2002 Bed, Bath and Beyond annual report below. You can navigate through the pages in the report by either clicking on the pages listed below, or by using the keyword search tool below to find specific information within the annual report.-
 1
1 -
 2
2 -
 3
3 -
 4
4 -
 5
5 -
 6
6 -
 7
7 -
 8
8 -
 9
9 -
 10
10 -
 11
11 -
 12
12 -
 13
13 -
 14
14 -
 15
15 -
 16
16 -
 17
17 -
 18
18 -
 19
19 -
 20
20 -
 21
21
 |
 |

BED BATH & BEYOND ANNUAL REPORT 2002
9
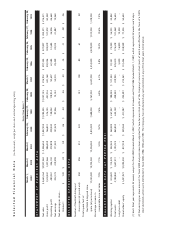
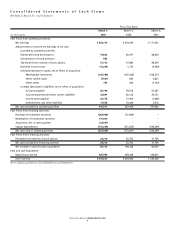
Consolidated Statements of Cash Flows
Bed Bath & Beyond Inc. and Subsidiaries
FISCAL YEAR ENDED
March 1, March 2, March 3,
(in thousands) 2003 2002 2001
Cash Flows from Operating Activities:
Net earnings $ 302,179) $ 219,599) $ 171,922)
Adjustments to reconcile net earnings to net cash
provided by operating activities:
Depreciation and amortization 74,825) 62,547) 46,650)
Amortization of bond premium 985) –) –)
Tax benefit from exercise of stock options 31,176) 31,980) 48,295)
Deferred income taxes (13,291) 1,733) (3,939)
(Increase) decrease in assets, net of effect of acquisition:
Merchandise inventories (145,789) (147,268) (136,271)
Other current assets (7,927) 644) 2,627)
Other assets 190) 206) (1,124)
Increase (decrease) in liabilities, net of effect of acquisition:
Accounts payable 86,144) 78,516) 47,287)
Accrued expenses and other current liabilities 52,891) 62,123) 20,721)
Income taxes payable 20,378) 17,450) (1,602)
Deferred rent and other liabilities 17,556) 10,426) 3,370)
Net cash provided by operating activities 419,317) 337,956) 197,936)
Cash Flows from Investing Activities:
Purchase of investment securities (368,008) (51,909) –)
Redemption of investment securities 170,000) –) ––)
Acquisition, net of cash acquired (24,097) –) –)
Capital expenditures (135,254) (121,632) (140,395)
Net cash used in investing activities (357,359) (173,541) (140,395)
Cash Flows from Financing Activities:
Proceeds from exercise of stock options 24,216) 25,753) 37,756)
Net cash provided by financing activities 24,216) 25,753) 37,756)
Net increase in cash and cash equivalents 86,174)190,168) 95,297)
Cash and cash equivalents:
Beginning of period 429,496) 239,328) 144,031)
End of period $ 515,670) $ 429,496) $ 239,328)
See accompanying Notes to Consolidated Financial Statements.