Bed, Bath and Beyond 2002 Annual Report Download - page 14
Download and view the complete annual report
Please find page 14 of the 2002 Bed, Bath and Beyond annual report below. You can navigate through the pages in the report by either clicking on the pages listed below, or by using the keyword search tool below to find specific information within the annual report.-
 1
1 -
2
-
3
-
 4
4 -
 5
5 -
 6
6 -
 7
7 -
 8
8 -
 9
9 -
 10
10 -
 11
11 -
 12
12 -
 13
13 -
 14
14 -
 15
15 -
 16
16 -
 17
17 -
 18
18 -
 19
19 -
 20
20 -
 21
21
 |
 |

BED BATH & BEYOND ANNUAL REPORT 2002
12
O. COST OF SALES
Cost of sales includes the cost of merchandise; certain buying,
occupancy and indirect costs; shipping and handling costs and
free merchandise incentives.
P. STORE OPENING, EXPANSION, RELOCATION AND CLOSING COSTS
Store opening, expansion, relocation and closing costs are
charged to earnings as incurred. Prior to the adoption of SFAS
No. 146, which was effective for any exit or disposal activity
initiated after December 31, 2002, costs related to store
relocations and closings were provided for in the period in which
management approved the relocation or closing of a store.
Q. ADVERTISING COSTS
Expenses associated with store advertising are charged to
earnings as incurred. Net advertising costs amounted to $58.8
million, $46.1 million and $37.0 million for fiscal 2002, 2001
and 2000, respectively.
R. INCOME TAXES
The Company files a consolidated Federal income tax return.
Separate income tax returns are filed with each state and territory
in which the Company conducts business.
The Company accounts for its income taxes using the asset
and liability method. Deferred tax assets and liabilities are
recognized for the future tax consequences attributable to the
differences between the financial statement carrying amounts
of existing assets and liabilities and their respective tax bases and
operating loss and tax credit carryforwards. Deferred tax assets
and liabilities are measured using enacted tax rates expected
to apply to taxable income in the year in which those temporary
differences are expected to be recovered or settled. The effect
on deferred tax assets and liabilities of a change in tax rates is
recognized in earnings in the period that includes the enactment
date.
S. EARNINGS PER SHARE
The Company presents earnings per share on a basic and diluted
basis. Basic earnings per share has been computed by dividing net
earnings by the weighted average number of shares outstanding.
Diluted earnings per share has been computed by dividing net
earnings by the weighted average number of shares outstanding
including the dilutive effect of stock options.
Options for which the exercise price was greater than the
average market price of common shares as of the fiscal years
ended 2002, 2001 and 2000 were not included in the compu-
tation of diluted earnings per share as the effect would be
anti-dilutive. These consisted of options totaling 158,925 shares,
22,275 shares and 115,925 shares, respectively.
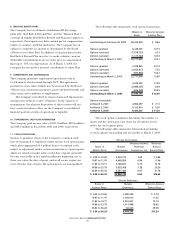
T. STOCK-BASED COMPENSATION
As permitted under SFAS No. 123, and subsequently amended
by SFAS No. 148, the Company has elected not to adopt the
fair value based method of accounting for its stock-based
compensation plans, but continues to apply the provisions
of APB No. 25. The Company has complied with the disclosure
requirements of SFAS No. 123.
Accordingly, no compensation cost has been recognized in
connection with the stock option plans. Set forth below are the
Company’s net earnings and net earnings per share “as reported,”
and as if compensation cost had been recognized (“pro-forma”)
in accordance with the fair value provisions of SFAS No. 123:
FISCAL YEAR
(in thousands) 2002 2001 2000
NET EARNINGS:
As reported $ 302,179)$ 219,599)$ 171,922)
Deduct: Total stock-based
employee compensation
expense determined
under fair value based
method, net of related
tax effects (25,443) (19,590) (17,382)
Pro-forma $ 276,736)$ 200,009)$ 154,540)
NET EARNINGS PER SHARE:
Basic:
As reported $1.03)$ 0.76)$ 0.61)
Pro-forma $0.94)$ 0.69)$ 0.54)
Diluted:
As reported $1.00
)$ 0.74)$ 0.59)
Pro-forma $0.92)$ 0.67)$ 0.53)
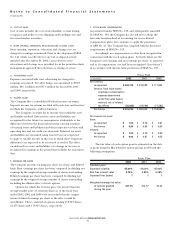
The fair value of each option grant is estimated on the date
of grant using the Black-Scholes option-pricing model with the
following assumptions:
FISCAL YEAR
2002 2001 2000
Dividend yield –––
Expected volatility 45.00% 45.00% 45.00%
Risk free interest rates 4.72% 4.80% 6.58%
Expected lives (years) 777
Weighted average fair value
of options granted $17.15 $12.77 $7.25
during the year
Notes to Consolidated Financial Statements
(Continued)