Bed, Bath and Beyond 2002 Annual Report Download - page 10
Download and view the complete annual report
Please find page 10 of the 2002 Bed, Bath and Beyond annual report below. You can navigate through the pages in the report by either clicking on the pages listed below, or by using the keyword search tool below to find specific information within the annual report.-
 1
1 -
 2
2 -
 3
3 -
 4
4 -
 5
5 -
 6
6 -
 7
7 -
 8
8 -
 9
9 -
 10
10 -
 11
11 -
 12
12 -
 13
13 -
 14
14 -
 15
15 -
 16
16 -
 17
17 -
 18
18 -
 19
19 -
 20
20 -
 21
21
 |
 |

BED BATH & BEYOND ANNUAL REPORT 2002
8
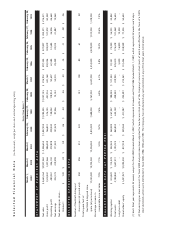
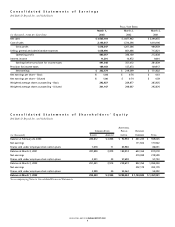
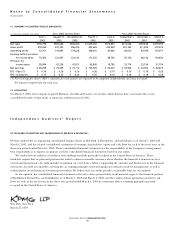
Consolidated Statements of Earnings
Bed Bath & Beyond Inc. and Subsidiaries
Consolidated Statements of Shareholders’ Equity
Bed Bath & Beyond Inc. and Subsidiaries
FISCAL YEAR ENDED
March 1, March 2, March 3,
(in thousands, except per share data) 2003 2002 2001
Net sales $ 3,665,164 $ 2,927,962 $ 2,396,655
Cost of sales 2,146,617 1,720,396 1,410,196
Gross profit 1,518,547 1,207,566 986,459
Selling, general and administrative expenses 1,038,490 861,466 713,621
Operating profit 480,057 346,100 272,838
Interest income 11,291 10,972 9,001
Earnings before provision for income taxes 491,348 357,072 281,839
Provision for income taxes 189,169 137,473 109,917
Net earnings $ 302,179 $ 219,599 $ 171,922
Net earnings per share – Basic $1.03 $ 0.76 $ 0.61
Net earnings per share – Diluted $1.00 $ 0.74 $ 0.59
Weighted average shares outstanding – Basic 292,927 289,877 283,925
Weighted average shares outstanding – Diluted 301,147 298,667 292,876
ADDITIONAL
COMMON STOCK PAID-IN RETAINED
(in thousands) SHARES AMOUNT CAPITAL EARNINGS TOTAL
Balance at February 26, 2000 280,812 $ 2,808 $ 94,994 $ 461,243 $ 559,045
Net earnings 171,922 171,922
Shares sold under employee stock option plans 7,078 71 85,980 86,051
Balance at March 3, 2001 287,890 2,879 180,974 633,165 817,018
Net earnings 219,599 219,599
Shares sold under employee stock option plans 3,551 35 57,698 57,733
Balance at March 2, 2002 291,441 2,914 238,672 852,764 1,094,350
Net earnings 302,179 302,179
Shares sold under employee stock option plans 2,989 30 55,362 55,392
Balance at March 1, 2003 294,430 $ 2,944 $ 294,034 $ 1,154,943 $ 1,451,921
See accompanying Notes to Consolidated Financial Statements.