Bed, Bath and Beyond 2002 Annual Report Download - page 6
Download and view the complete annual report
Please find page 6 of the 2002 Bed, Bath and Beyond annual report below. You can navigate through the pages in the report by either clicking on the pages listed below, or by using the keyword search tool below to find specific information within the annual report.-
 1
1 -
 2
2 -
 3
3 -
 4
4 -
 5
5 -
 6
6 -
 7
7 -
 8
8 -
 9
9 -
 10
10 -
 11
11 -
 12
12 -
 13
13 -
 14
14 -
 15
15 -
 16
16 -
 17
17 -
18
-
19
-
20
-
21
 |
 |

BED BATH & BEYOND ANNUAL REPORT 2002
4
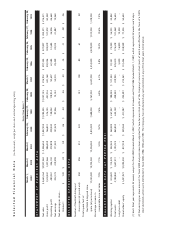
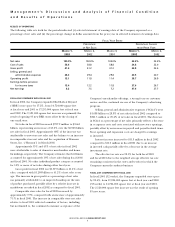
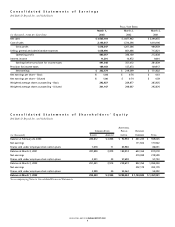
Net sales in fiscal 2001 increased $531.3 million to $2.928
billion, representing an increase of 22.2% over the $2.397 billion
net sales in fiscal 2000. Approximately 73% of the increase was
attributable to new store net sales and the balance to an increase
in comparable store net sales.
Approximately 54% and 46% of net sales in fiscal 2001
were attributable to sales of domestics merchandise and home
furnishings, respectively. The Company estimates that bed linens
accounted for approximately 19% of net sales during fiscal 2001
and 21% of net sales during fiscal 2000. No other individual
product category accounted for 10% or more of net sales during
either fiscal year.
Gross profit in fiscal 2001 was $1.208 billion or 41.2% of
net sales, compared with $986.5 million or 41.2% of net sales in
fiscal 2000. Gross profit, as a percentage of net sales, remained
consistent due to the similar product mix in fiscal 2001 and
fiscal 2000.
Comparable store sales for fiscal 2001 (52 weeks vs. 52 weeks)
increased by approximately 7.1%, compared with an increase
of approximately 5.0% in fiscal 2000. The increase in comparable
store net sales relative to fiscal 2000 reflected a number of factors,
including but not limited to, the continued consumer acceptance
of the Company’s merchandise offerings, a strong focus on
customer service and the continued success of the Company’s
advertising program.
SG&A was $861.5 million or 29.4% of net sales in fiscal 2001
compared to $713.6 million or 29.8% of net sales in fiscal 2000.
The decrease in SG&A as a percentage of net sales primarily
reflected a relative decrease in payroll and payroll related items
primarily due to an increase in store productivity. Store opening
and expansion costs were charged to earnings as incurred.
Interest income increased to $11.0 million in fiscal 2001
compared to $9.0 million in fiscal 2000 due to an increase in
invested cash partially offset by a decrease in the average
investment rate.
The effective tax rate decreased to 38.5% for fiscal 2001
compared with 39.0% for fiscal 2000 due to a decrease in the
amount provided for state and local taxes resulting primarily
from the composition of states and territory in which the
Company currently conducts business.
EXPANSION PROGRAM
The Company is engaged in an ongoing expansion program
involving the opening of new stores in both new and existing
markets and the expansion or relocation of existing stores.
In the eleven year period from the beginning of fiscal 1992 to the
end of fiscal 2002, the chain has grown from 34 to 490 BBB
stores. Total BBB stores’ square footage grew from 917,000 square
feet at the beginning of fiscal 1992 to 17,255,000 square feet at
the end of fiscal 2002. There were 29 Harmon stores with 197,000
square feet at the end of fiscal 2002.
The Company intends to continue its expansion program
and currently anticipates that in fiscal 2003 it will open between
80 and 90 new BBB stores (see details under “Liquidity and
Capital Resources” below). The Company believes that a
predominant portion of any increase in its net sales in fiscal
2003 will continue to be attributable to new store net sales.
Accordingly, the continued growth of the Company is dependent,
in large part, upon the Company’s ability to execute its expansion
program successfully, of which there can be no assurance.
LIQUIDITY AND CAPITAL RESOURCES
The Company has been able to finance its operations, including
its expansion program, through internally generated funds.
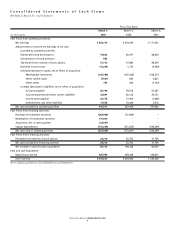
Net cash provided by operating activities in fiscal 2002 was
$419.3 million, compared with $338.0 million in fiscal 2001.
The change in net cash provided by operating activities was
primarily attributable to an increase in net income.
Net cash used in investing activities in fiscal 2002 was $357.4
million, compared with $173.5 million in fiscal 2001. The change
in net cash used in purchases of investing activities is primarily
attributable to an increase in investment securities and the
acquisition of Harmon.
Net cash provided by financing activities in fiscal 2002
was $24.2 million, compared with $25.8 million in fiscal 2001.
The change in net cash provided by financing activities is
attributable to a decrease in proceeds from the exercise of
stock options compared to the prior year.
Management’s Discussion and Analysis of Financial Condition
and Results of Operations
(Continued)