Bed, Bath and Beyond 2000 Annual Report Download - page 21
Download and view the complete annual report
Please find page 21 of the 2000 Bed, Bath and Beyond annual report below. You can navigate through the pages in the report by either clicking on the pages listed below, or by using the keyword search tool below to find specific information within the annual report.-
 1
1 -
2
-
3
-
4
-
5
-
6
-
7
-
8
-
9
-
10
-
 11
11 -
 12
12 -
 13
13 -
 14
14 -
 15
15 -
 16
16 -
 17
17 -
 18
18 -
 19
19 -
 20
20 -
 21
21 -
 22
22 -
 23
23 -
 24
24
 |
 |

BED BATH & BEYOND ANNUAL REPORT 2000
19
TO THE BOARD OF DIRECTORS AND SHAREHOLDERS OF BED BATH & BEYOND INC.:
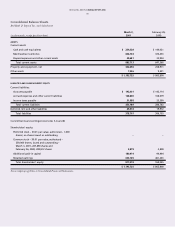
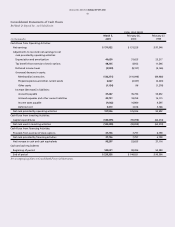
We have audited the accompanying consolidated balance sheets of Bed Bath & Beyond Inc. and subsidiaries as of March 3, 2001 and
February 26, 2000, and the related consolidated statements of earnings, shareholders’ equity, and cash flows for each of the fiscal years
in the three-year period ended March 3, 2001. These consolidated financial statements are the responsibility of the Company’s
management. Our responsibility is to express an opinion on these consolidated financial statements based on our audits.
We conducted our audits in accordance with auditing standards generally accepted in the United States of America. Those standards
require that we plan and perform the audit to obtain reasonable assurance about whether the financial statements are free of material
misstatement. An audit includes examining, on a test basis, evidence supporting the amounts and disclosures in the financial statements.
An audit also includes assessing the accounting principles used and significant estimates made by management, as well as evaluating the
overall financial statement presentation. We believe that our audits provide a reasonable basis for our opinion.
In our opinion, the consolidated financial statements referred to above present fairly, in all material respects, the financial
position of Bed Bath & Beyond Inc. and subsidiaries as of March 3, 2001 and February 26, 2000, and the results of their operations
and their cash flows for each of the fiscal years in the three-year period ended March 3, 2001 in conformity with accounting principles
generally accepted in the United States of America.
New York, New York
March 30, 2001
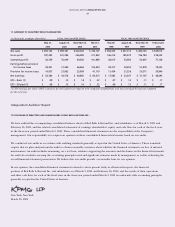
May 27, August 26, November 25, March 3, May 29, August 28, November 27, February 26,
2000 2000 2000 2001 1999 1999 1999 2000
Net sales $ 459,163 $ 589,381 $ 602,004 $ 746,107 $ 356,633 $ 451,715 $ 480,145 $ 569,012
Gross profit 187,293 241,284 246,080 311,802 146,214 185,570 196,784 238,233
Operating profit 36,339 70,009 64,592 101,898 28,015 53,580 50,607 77,138
Earnings before provision
for income taxes 38,301 71,440 66,664 105,434 29,317 54,503 51,978 79,332
Provision for income taxes 14,937 27,862 25,999 41,119 11,434 21,256 20,271 30,940
Net earnings $ 23,364 $ 43,578 $ 40,665 $ 64,315 $ 17,883 $ 33,247 $ 31,707 $ 48,392
EPS – Basic (1) $ .09 $ .15 $ .14 $ .22 $ .07 $ .12 $ .11 $ .17
EPS – Diluted (1) $ .08 $ .15 $ .14 $ .22 $ .06 $ .12 $ .11 $ .17
(1) Net earnings per share (“EPS”) amounts for each quarter are required to be computed independently and may not equal the amount computed
for the total year.
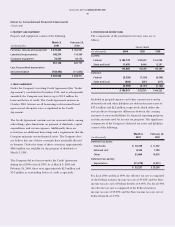
11. SUMMARY OF QUARTERLY RESULTS (UNAUDITED)
(in thousands, except per share data) FISCAL 2000 QUARTER ENDED FISCAL 1999 QUARTER ENDED
Independent Auditors’ Report