Bed, Bath and Beyond 2000 Annual Report Download - page 14
Download and view the complete annual report
Please find page 14 of the 2000 Bed, Bath and Beyond annual report below. You can navigate through the pages in the report by either clicking on the pages listed below, or by using the keyword search tool below to find specific information within the annual report.-
 1
1 -
2
-
3
-
 4
4 -
 5
5 -
 6
6 -
 7
7 -
 8
8 -
 9
9 -
 10
10 -
 11
11 -
 12
12 -
 13
13 -
 14
14 -
 15
15 -
 16
16 -
 17
17 -
 18
18 -
 19
19 -
 20
20 -
 21
21 -
 22
22 -
 23
23 -
 24
24
 |
 |

BED BATH & BEYOND ANNUAL REPORT 2000
12
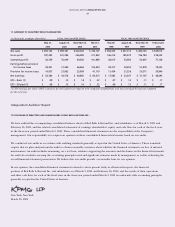
FISCAL YEAR ENDED
March 3, February 26, February 27,
(in thousands, except per share data) 2001 2000 1999
Net sales $ 2,396,655 $ 1,857,505 $ 1,382,345
Cost of sales, including buying, occupancy and indirect costs 1,410,196 1,090,704 806,220
Gross profit 986,459 766,801 576,125
Selling, general and administrative expenses 713,621 557,461 418,073
Operating profit 272,838 209,340 158,052
Interest income 9,001 5,790 3,517
Earnings before provision for income taxes 281,839 215,130 161,569
Provision for income taxes 109,917 83,901 64,223
Net earnings $ 171,922 $ 131,229 $ 97,346
Net earnings per share – Basic $.61 $ .47 $ .35
Net earnings per share – Diluted $ .59 $ .46 $ .34
Weighted average shares outstanding – Basic 283,925 279,930 277,684
Weighted average shares outstanding – Diluted 292,876 288,234 286,472
Consolidated Statements of Shareholders’ Equity
Bed Bath & Beyond Inc. and Subsidiaries
ADDITIONAL
COMMON STOCK PAID-IN RETAINED
(in thousands) SHARES AMOUNT CAPITAL EARNINGS TOTAL
Balance at February 28, 1998 276,176 $ 2,762 $ 59,967 $ 232,668 $ 295,397
Net earnings 97,346 97,346
Shares sold under employee stock option plans 2,660 26 18,318 18,344
Balance at February 27, 1999 278,836 2,788 78,285 330,014 411,087
Net earnings 131,229 131,229
Shares sold under employee stock option plans 1,976 20 16,709 16,729
Balance at February 26, 2000 280,812 2,808 94,994 461,243 559,045
Net earnings 171,922 171,922
Shares sold under employee stock option plans 7,078 71 85,980 86,051
Balance at March 3, 2001 287,890 $ 2,879 $ 180,974 $ 633,165 $ 817,018
See accompanying Notes to Consolidated Financial Statements.
Consolidated Statements of Earnings
Bed Bath & Beyond Inc. and Subsidiaries