Bed, Bath and Beyond 2000 Annual Report Download - page 2
Download and view the complete annual report
Please find page 2 of the 2000 Bed, Bath and Beyond annual report below. You can navigate through the pages in the report by either clicking on the pages listed below, or by using the keyword search tool below to find specific information within the annual report.-
 1
1 -
 2
2 -
 3
3 -
 4
4 -
 5
5 -
 6
6 -
 7
7 -
 8
8 -
 9
9 -
 10
10 -
 11
11 -
 12
12 -
 13
13 -
14
-
15
-
16
-
17
-
18
-
19
-
20
-
21
-
22
-
23
-
24
 |
 |

BED BATH & BEYOND ANNUAL REPORT 2000
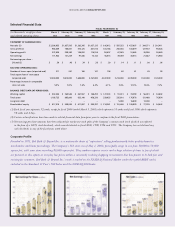
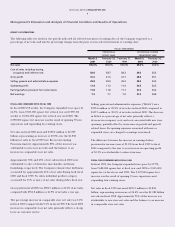
Selected Financial Data
FISCAL YEAR ENDED (1)
(in thousands, except per share March 3, February 26, February 27, February 28, March 1, February 25, February 26, February 27, February 28,
and selected operating data) 2001 2000 1999 1998 1997 1996 1995 1994 1993
STATEMENT OF EARNINGS DATA:
Net sales (2) $ 2,396,655 $ 1,857,505 $1,382,345 $1,057,135 $ 816,912 $ 597,352 $ 437,807 $ 304,571 $ 216,411
Gross profit (2) 986,459 766,801 576,125 441,016 341,168 250,036 183,819 127,972 90,528
Operating profit 272,838 209,340 158,052 118,914 90,607 67,585 51,685 36,906 26,660
Net earnings 171,922 131,229 97,346 73,142 55,015 39,459 30,013 21,887 15,960
Net earnings per share –
Diluted (3) $ .59 $ .46 $ .34 $ .26 $ .20 $ .14 $ .11 $ .08 $ .06
SELECTED OPERATING DATA:
Number of stores open (at period end) 311 241 186 141 108 80 61 45 38
Total square feet of store space
(at period end) 12,204,000 9,815,000 7,688,000 5,767,000 4,347,000 3,214,000 2,339,000 1,512,000 1,128,000
Percentage increase in comparable
store net sales 5.0% 9.2% 7.6% 6.4% 6.1% 3.8% 12.0% 10.6% 7.2%
BALANCE SHEET DATA (AT PERIOD END):
Working capital $ 532,524 $ 360,585 $ 267,557 $ 188,293 $ 127,333 $ 91,331 $ 74,390 $ 56,001 $ 34,842
Total assets 1,195,725 865,800 633,148 458,330 329,925 235,810 176,678 121,468 76,654
Long-term debt – – – – – 5,000 16,800 13,300 –
Shareholders’ equity $ 817,018 $ 559,045 $ 411,087 $ 295,397 $ 214,361 $ 151,446 $ 108,939 $ 77,305 $ 54,643
(1) Each fiscal year represents 52 weeks, except for fiscal 2000 (ended March 3, 2001) which represents 53 weeks and fiscal 1996 which represents
52 weeks and 6 days.
(2) Certain reclassifications have been made to selected financial data from prior years to conform to the fiscal 2000 presentation.
(3) Net earnings per share amounts have been adjusted for two-for-one stock splits of the Company’s common stock (each of which was effected
in the form of a 100% stock dividend), which were distributed in fiscal 2000, 1998, 1996 and 1993. The Company has not declared any
cash dividends in any of the fiscal years noted above.
Corporate Profile
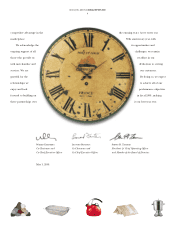
Founded in 1971, Bed Bath & Beyond Inc. is a nationwide chain of “superstores” selling predominantly better quality domestics
merchandise and home furnishings. The Company’s 316 stores (as of May 1, 2001) principally range in size from 30,000 to 50,000
square feet, with some stores exceeding 80,000 square feet. They combine superior service and a huge selection of items (a few of which
are pictured in this report) at everyday low prices within a constantly evolving shopping environment that has proven to be both fun and
exciting for customers. Bed Bath & Beyond Inc.’s stock is traded on the NASDAQ National Market under the symbol BBBY and is
included in the Standard & Poor’s 500 Index and the NASDAQ-100 Index.