Bed, Bath and Beyond 2000 Annual Report Download - page 11
Download and view the complete annual report
Please find page 11 of the 2000 Bed, Bath and Beyond annual report below. You can navigate through the pages in the report by either clicking on the pages listed below, or by using the keyword search tool below to find specific information within the annual report.-
 1
1 -
 2
2 -
 3
3 -
 4
4 -
 5
5 -
 6
6 -
 7
7 -
 8
8 -
 9
9 -
 10
10 -
 11
11 -
 12
12 -
 13
13 -
 14
14 -
 15
15 -
 16
16 -
 17
17 -
 18
18 -
 19
19 -
 20
20 -
 21
21 -
 22
22 -
23
-
24
 |
 |

BED BATH & BEYOND ANNUAL REPORT 2000
9
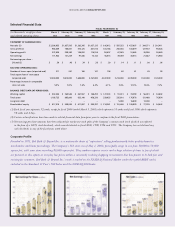
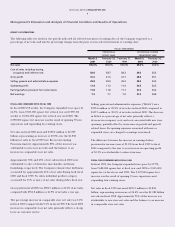
Approximately 55% and 45% of net sales in fiscal 1999 were
attributable to sales of domestics merchandise and home
furnishings, respectively. The Company estimates that bed linens
accounted for approximately 21% of net sales during both fiscal
1999 and fiscal 1998. No other individual product category
accounted for 10% or more of net sales during either fiscal year.
Gross profit in fiscal 1999 was $766.8 million or 41.3% of net
sales, compared with $576.1 million or 41.7% of net sales in
fiscal 1998. The decrease in gross profit as a percentage of net
sales was primarily attributable to a different mix of sales during
fiscal 1999 compared to the mix of sales during fiscal 1998, as
well as a continued emphasis on providing value pricing to the
customer.
The percentage increase in comparable store net sales was 9.2%
in fiscal 1999 compared with 7.6% in fiscal 1998. The increase in
comparable store net sales relative to fiscal 1998 reflected a
number of factors, including the continued consumer
acceptance of the Company’s merchandise offerings, the
continued emphasis on providing value pricing to the customer,
a strong focus on customer service and the generally favorable
retailing environment.
SG&A was $557.5 million or 30.0% of net sales in fiscal 1999
compared to $418.1 million or 30.2% of net sales in fiscal 1998.
The decrease in SG&A as a percentage of net sales primarily
reflected a decrease in payroll and payroll related items and
occupancy costs. Preopening expenses associated with new or
expanded stores were charged to earnings as incurred.
The difference between the increase in earnings before
provision for income taxes of 33.2% from fiscal 1998 to fiscal
1999 compared to the year to year increase in operating profit of
32.5% was attributable to interest income.
EXPANSION PROGRAM
The Company is engaged in an ongoing expansion program
involving the opening of new stores in both new and existing
markets and the expansion or replacement of existing stores
with larger stores. In the nine year period from the beginning of
fiscal 1992 to the end of fiscal 2000, the chain has grown from
34 stores to 311 stores. Total square footage grew from 917,000
square feet at the beginning of fiscal 1992 to 12,204,000 square
feet at the end of fiscal 2000.
The Company intends to continue its expansion program and
currently anticipates that in fiscal 2001 it will open at least 80
new stores (see details under “Liquidity and Capital Resources”
below). The Company believes that a predominant portion of
any increase in its net sales in fiscal 2001 will continue to be
attributable to new store net sales. Accordingly, the continued
growth of the Company is dependent, in large part, upon the
Company’s ability to execute its expansion program successfully,
of which there can be no assurance.
LIQUIDITY AND CAPITAL RESOURCES
The Company has been able to finance both its normal
operations and its expansion program principally through
internally generated funds during the preceding five years.
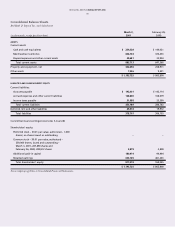
The Company’s merchandise inventory has grown from $360.3
million at the end of fiscal 1998, to $470.4 million at the end
of fiscal 1999 and to $606.7 million at the end of fiscal 2000.
The increases in inventory between the fiscal years were
primarily attributable to the addition of new store space.
The Company’s working capital increased from $267.6 million at
the end of fiscal 1998, to $360.6 million at the end of fiscal 1999,
and to $532.5 million at the end of fiscal 2000. The increases
between the fiscal years were primarily the result of increases in
merchandise inventories and cash and cash equivalents, which
were partially offset by increases in accounts payable and
accrued expenses and other current liabilities.
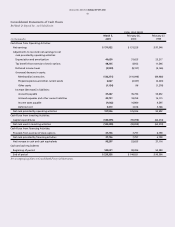
The Company’s expansion program requires the Company to
make capital expenditures for furniture and fixtures, leasehold
improvements and computer equipment on an ongoing basis.
The Company’s total capital expenditures were $140.4 million,
$90.1 million and $62.3 million during fiscal 2000, 1999 and
1998, respectively.
Under the Company’s revolving Credit Agreement (the “Credit
Agreement”) concluded in November 1994, and as subsequently
amended, the Company may borrow up to $25.0 million for
loans and letters of credit. The Credit Agreement matures in
October 2001.