Bed, Bath and Beyond 2000 Annual Report Download - page 10
Download and view the complete annual report
Please find page 10 of the 2000 Bed, Bath and Beyond annual report below. You can navigate through the pages in the report by either clicking on the pages listed below, or by using the keyword search tool below to find specific information within the annual report.-
 1
1 -
 2
2 -
 3
3 -
 4
4 -
 5
5 -
 6
6 -
 7
7 -
 8
8 -
 9
9 -
 10
10 -
 11
11 -
 12
12 -
 13
13 -
 14
14 -
 15
15 -
 16
16 -
 17
17 -
 18
18 -
 19
19 -
 20
20 -
 21
21 -
22
-
23
-
24
 |
 |

BED BATH & BEYOND ANNUAL REPORT 2000
8
FISCAL 2000 COMPARED WITH FISCAL 1999
In fiscal 2000 (53 weeks), the Company expanded store space by
24.3%, from 9,815,000 square feet at fiscal year end 1999 (52
weeks) to 12,204,000 square feet at fiscal year end 2000. The
2,389,000 square feet increase was the result of opening 70 new
superstores and expanding two existing stores.
Net sales in fiscal 2000 increased $539.2 million to $2.397
billion, representing an increase of 29.0% over the $1.858
billion net sales in fiscal 1999 (see Recent Accounting
Pronouncements). Approximately 83% of the increase was
attributable to new store net sales and the balance to an
increase in comparable store net sales.
Approximately 55% and 45% of net sales in fiscal 2000 were
attributable to sales of domestics merchandise and home
furnishings, respectively. The Company estimates that bed linens
accounted for approximately 21% of net sales during both fiscal
2000 and fiscal 1999. No other individual product category
accounted for 10% or more of net sales during either fiscal year.
Gross profit in fiscal 2000 was $986.5 million or 41.2% of net sales,
compared with $766.8 million or 41.3% of net sales a year ago.
The percentage increase in comparable store net sales was 5.0%
in fiscal 2000 compared with 9.2% in fiscal 1999. The fiscal 2000
increase in comparable store net sales primarily reflects a strong
focus on customer service.
Selling, general and administrative expenses (“SG&A”) were
$713.6 million or 29.8% of net sales in fiscal 2000 compared to
$557.5 million or 30.0% of net sales in fiscal 1999. The decrease
in SG&A as a percentage of net sales primarily reflects a
decrease in occupancy costs and costs associated with new store
openings, partially offset by an increase in payroll and payroll
related items. Preopening expenses associated with new or
expanded stores are charged to earnings as incurred.
The difference between the increase in earnings before
provision for income taxes of 31.0% from fiscal 1999 to fiscal
2000 compared to the year to year increase in operating profit
of 30.3% was attributable to interest income.
FISCAL 1999 COMPARED WITH FISCAL 1998
In fiscal 1999, the Company expanded store space by 27.7%,
from 7,688,000 square feet at fiscal year end 1998 to 9,815,000
square feet at fiscal year end 1999. The 2,127,000 square feet
increase was the result of opening 55 new superstores and
expanding four existing stores.
Net sales in fiscal 1999 increased $475.2 million to $1.858
billion, representing an increase of 34.4% over the $1.382 billion
net sales in fiscal 1998. Approximately 75% of the increase was
attributable to new store net sales and the balance to an increase
in comparable store net sales.
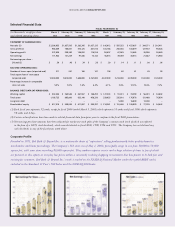
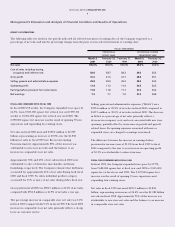
RESULTS OF OPERATIONS
The following table sets forth for the periods indicated (i) selected statement of earnings data of the Company expressed as a
percentage of net sales and (ii) the percentage change from the prior year in selected statement of earnings data:
FISCAL YEAR ENDED
PERCENTAGE PERCENTAGE CHANGE
OF NET SALES FROM PRIOR YEAR
March 3, February 26, February 27, March 3, February 26,
2001 2000 1999 2001 2000
Net sales 100.0% 100.0% 100.0% 29.0% 34.4%
Cost of sales, including buying,
occupancy and indirect costs 58.8 58.7 58.3 29.3 35.3
Gross profit 41.2 41.3 41.7 28.6 33.1
Selling, general and administrative expenses 29.8 30.0 30.2 28.0 33.3
Operating profit 11.4 11.3 11.4 30.3 32.5
Earnings before provision for income taxes 11.8 11.6 11.7 31.0 33.2
Net earnings 7.2 7.1 7.0 31.0 34.8
Management’s Discussion and Analysis of Financial Condition and Results of Operations