Bed, Bath and Beyond 2000 Annual Report Download - page 20
Download and view the complete annual report
Please find page 20 of the 2000 Bed, Bath and Beyond annual report below. You can navigate through the pages in the report by either clicking on the pages listed below, or by using the keyword search tool below to find specific information within the annual report.-
 1
1 -
2
-
3
-
4
-
5
-
6
-
7
-
8
-
9
-
 10
10 -
 11
11 -
 12
12 -
 13
13 -
 14
14 -
 15
15 -
 16
16 -
 17
17 -
 18
18 -
 19
19 -
 20
20 -
 21
21 -
 22
22 -
 23
23 -
 24
24
 |
 |

BED BATH & BEYOND ANNUAL REPORT 2000
18
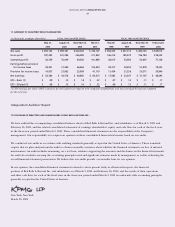
Option grants have been at market value, non-qualified and
generally exercisable in five equal annual installments beginning
one to three years after the date of grant and expire ten years
from the date of grant.
The following table summarizes stock option transactions:
WEIGHTED-
NUMBER OF AVERAGE
SHARES EXERCISE PRICE
Outstanding at February 28, 1998 21,209,796)$ 4.81
Options granted 5,540,400)11.77
Options exercised (2,660,298) 2.55
Options canceled (617,360) 6.10
Outstanding at February 27, 1999 23,472,538)6.67
Options granted 5,533,900)15.49
Options exercised (1,975,374) 3.94
Options canceled (807,064) 9.67
Outstanding at February 26, 2000 26,224,000)8.65
Options granted 6,149,700)12.73
Options exercised (7,078,153) 5.33
Options canceled (1,123,562) 12.02
Outstanding at March 3, 2001 24,171,985)$10.51
Options exercisable:
At February 27, 1999 5,077,618)$ 3.84
At February 26, 2000 7,240,180)$ 4.81
At March 3, 2001 4,904,297)$ 7.12
The stock option committees determine the number of shares
and the option price per share for all options issued under the
stock option plans.
The following tables summarize information pertaining to stock
options outstanding and exercisable at March 3, 2001:
OPTIONS OUTSTANDING
WEIGHTED-AVERAGE WEIGHTED-
RANGE OF NUMBER REMAINING AVERAGE
EXERCISE PRICES OUTSTANDING CONTRACTUAL LIFE EXERCISE PRICE
$ 1.06 to 6.12 4,295,046 4.35 $ 3.69
6.19 to 10.38 4,601,534 6.39 7.33
10.69 to 11.47 5,093,820 8.95 11.45
11.83 to 14.19 4,159,315 7.28 11.92
14.77 to 26.78 6,022,270 8.54 16.01
$ 1.06 to 26.78 24,171,985 7.26 $10.51
OPTIONS EXERCISABLE
WEIGHTED-
RANGE OF NUMBER AVERAGE
EXERCISE PRICES EXERCISABLE EXERCISE PRICE
$ 1.06 to 6.12 2,609,526 $ 3.40
6.19 to 10.38 832,974 7.27
10.69 to 11.47 73,300 11.15
11.83 to 14.19 554,555 12.03
14.77 to 26.78 833,942 14.98
$ 1.06 to 26.78 4,904,297 $ 7.12
The Company applies APB No. 25 and related interpretations
in accounting for its stock option plans. Accordingly, no
compensation cost has been recognized in connection with the
stock option plans. Set forth below are the Company’s net
earnings and net earnings per share “as reported”, and as if
compensation cost had been recognized in accordance with the
fair value provisions of SFAS No. 123:
FISCAL YEARS
(in thousands, except per share data) 2000 1999 1998
NET EARNINGS:
As reported $171,922 $131,229 $97,346
Pro forma $154,540 $119,158 $89,519
NET EARNINGS PER SHARE:
Basic:
As reported $ 0.61 $ 0.47 $ 0.35
Pro forma $ 0.54 $ 0.43 $ 0.32
Diluted:
As reported $ 0.59 $ 0.46 $ 0.34
Pro forma $ 0.53 $ 0.41 $ 0.31
The fair value of each option grant is estimated on the date of
grant using the Black-Scholes option-pricing model with the
following assumptions used for grants for fiscal 2000, 1999 and
1998, respectively: dividend yield of 0% for all years; expected
volatility of 45%, 42% and 42%; risk free interest rates of 6.58%,
5.95% and 5.58%; and expected lives of seven years, seven years
and six years. The weighted-average fair value of options granted
during the year is $7.25, $8.34 and $6.06 for fiscal 2000, 1999
and 1998, respectively.
Notes to Consolidated Financial Statements
(Continued)