BT 2014 Annual Report Download - page 10
Download and view the complete annual report
Please find page 10 of the 2014 BT annual report below. You can navigate through the pages in the report by either clicking on the pages listed below, or by using the keyword search tool below to find specific information within the annual report.-
 1
1 -
 2
2 -
 3
3 -
 4
4 -
 5
5 -
 6
6 -
 7
7 -
 8
8 -
 9
9 -
 10
10 -
 11
11 -
 12
12 -
 13
13 -
 14
14 -
 15
15 -
 16
16 -
 17
17 -
 18
18 -
 19
19 -
 20
20 -
 21
21 -
22
-
23
-
24
-
25
-
26
-
27
-
28
-
29
-
30
-
31
-
32
-
33
-
34
-
35
-
36
-
37
-
38
-
39
-
40
-
41
-
42
-
43
-
44
-
45
-
46
-
47
-
48
-
49
-
50
-
51
-
52
-
53
-
54
-
55
-
56
-
57
-
58
-
59
-
60
-
61
-
62
-
63
-
64
-
65
-
66
-
67
-
68
-
69
-
70
-
71
-
72
-
73
-
74
-
75
-
76
-
77
-
78
-
79
-
80
-
81
-
82
-
83
-
84
-
85
-
86
-
87
-
88
-
89
-
90
-
91
-
92
-
93
-
94
-
95
-
96
-
97
-
98
-
99
-
100
-
101
-
102
-
103
-
104
-
105
-
106
-
107
-
108
-
109
-
110
-
111
-
112
-
113
-
114
-
115
-
116
-
117
-
118
-
119
-
120
-
121
-
122
-
123
-
124
-
125
-
126
-
127
-
128
-
129
-
130
-
131
-
132
-
133
-
134
-
135
-
136
-
137
-
138
-
139
-
140
-
141
-
142
-
143
-
144
-
145
-
146
-
147
-
148
-
149
-
150
-
151
-
152
-
153
-
154
-
155
-
156
-
157
-
158
-
159
-
160
-
161
-
162
-
163
-
164
-
165
-
166
-
167
-
168
-
169
-
170
-
171
-
172
-
173
-
174
-
175
-
176
-
177
-
178
-
179
-
180
-
181
-
182
-
183
-
184
-
185
-
186
-
187
-
188
-
189
-
190
-
191
-
192
-
193
-
194
-
195
-
196
-
197
-
198
-
199
-
200
-
201
-
202
-
203
-
204
-
205
-
206
-
207
-
208
-
209
-
210
-
211
-
212
-
213
 |
 |

Overview
Overview
Key performance indicators
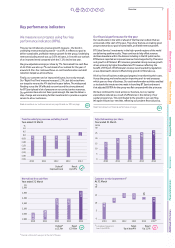
e measure our progress using four key
performance indicators (Is).
This year we introduced a revenue growth measure the trend in
underlying revenue excluding transit as a I. It reects our goal to
deliver sustainable, protable revenue growth for the group. Underlying
revenue excluding transit was up . this year, in line with our outlook
of an improved trend compared with the . decline last year.
e grew adjusted earnings per share by . ormalised free cash ow
of 2.bn was also up and ahead of our outlook for the year of
around 2.bn. Our continued focus on cost transformation and debt
reduction helped us achieve these.
Finally, our customer service improved this year, but not by enough.
OurRight First Time measure increased ., but did not achieve
our target to reverse the decline the year before. The widespread
ooding across the U aected our service and the strong demand
for BT port placed a lot of pressure on our contact centre resources.
Ourprocesses have also not been good enough. e need to deliver a
step-change and are making further investments to provide a superior
service to all our customers.
5eaG more about our customer serYice on paJe 16 anG our .3,s on paJe
60
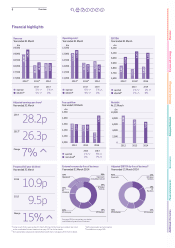
Our Ƭnancial performance for the year
Our results were in line with or ahead of the nancial outlook that we
announced at the start of the year. They show that we are making good
progress towards our goal of sustainable, protable revenue growth.
BT lobal ervices investments in the high-growth regions of the world
are delivering positive results. These continue to help oset revenue
declines elsewhere within the division including in the U public sector.
BT Business reported an improved revenue trend supported by IT services
and growth in BT Ireland. BT onsumer generated strong revenue growth
driven primarily by higher broadband and T revenue reecting the
benet of BT port. BT holesales revenue was impacted by regulation
as was Openreachs where it oset strong growth in bre take-up.
All of our lines of business made good progress in transforming their costs.
Across the group, we have focused on improving end-to-end processes
which span our lines of business. Our cost transformation activities enabled
us to absorb the investment we made in launching BT port and meant
that adjusted EBITDA for the group was at compared with the prior year.
e have continued to invest across our business, but our capital
expenditure reduced as a result of eciencies in the delivery of our
capital programmes. This contributed to the growth in our cash ow.
eagain reduced our net debt, reecting our prudent nancial policy.
5eaG more about our ƬnanciaO performance on paJe
59
a FinanciaO outOook which was JiYen at the start of the \ear
%
2011 20122010 2013 2014
Trend in underlying revenue excluding transit
Year ended 31 March
(3.5)
(3.0)
(2.5)
(2.0)
(1.5)
(1.0)
(0.5)
0.0
0.5
1.0
(1.9)
(3.0)
(2.9)
0.5
(3.1)
OutlookaResult
Improved trend Up 0.5%
£m
2011 20122010 2013 2014
Normalised free cash Ʈow
Year ended 31 March
1,900
2,000
2,100
2,200
2,300
2,400
2,500
2,307
2,076
2,032
2,450
2,300
OutlookaResult
c.£2.3bn £2.45bn
pence
2011 20122010 2013 2014
Adjusted earnings per share
Year ended 31 March
23.4
20.7
17.1
28.2
26.3
0
5
10
15
20
25
30
10
5
15
20
%
2011 20122010 2013 2014 2014b
Customer service improvementb
At 31 March
0
10.5
3.0
3.0
(4.0)
14.0
1.5
Target Result
Up at least 4% Up 1.5%
b &umuOatiYe improYement
from 1 $priO 200