Anthem Blue Cross 2010 Annual Report Download - page 13
Download and view the complete annual report
Please find page 13 of the 2010 Anthem Blue Cross annual report below. You can navigate through the pages in the report by either clicking on the pages listed below, or by using the keyword search tool below to find specific information within the annual report.-
 1
1 -
2
-
 3
3 -
 4
4 -
 5
5 -
 6
6 -
 7
7 -
 8
8 -
 9
9 -
 10
10 -
 11
11 -
 12
12 -
 13
13 -
 14
14 -
 15
15 -
 16
16 -
 17
17 -
 18
18 -
 19
19 -
 20
20 -
 21
21 -
 22
22 -
 23
23 -
24
-
25
-
26
-
27
-
28
-
29
-
30
-
31
-
32
-
33
-
34
-
35
-
36
 |
 |

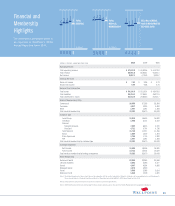
(dollars in millions, except per share data) 2010 2009 2008
Operating Results
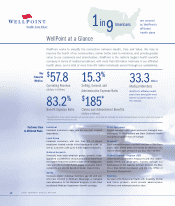
Total operating revenue $ 57,843.8 $ 60,828.6 $ 61,579.2
Total revenue 58,801.8 65,028.1 61,251.1
Net income 2,887.1 4,745.9 2,490.7
Earnings Per Share
Basic net income $ 7.03 $ 9.96 $ 4.79
Diluted net income 6.94 9.88 4.76
Balance Sheet Information
Total assets $ 50,166.9 $ 52,125.4 $ 48,403.2
Total liabilities 26,354.3 27,262.1 26,971.5
Total shareholders’ equity 23,812.6 24,863.3 21,431.7
Medical Membership (000s)
Commercial 26,959 27,356 28,304
Consumer 4,917 4,923 5,352
Other 1,447 1,391 1,393
Total medical membership 33,323 33,670 35,049
Customer Type
Local Group 15,216 15,643 16,632
Individual 1,905 2,131 2,272
National:
National Accounts 7,029 6,813 6,720
BlueCard 4,711 4,744 4,736
Total National 11,740 11,557 11,456
Senior 1,259 1,215 1,304
State-Sponsored 1,756 1,733 1,992
FEP 1,447 1,391 1,393
Total medical membership by customer type 33,323 33,670 35,049
Funding Arrangement
Self-Funded 19,590 18,236 18,520
Fully-Insured 13,733 15,434 16,529
Total medical membership by funding arrangement 33,323 33,670 35,049
Other Membership
Behavioral health 23,963 22,965 23,568
Life and disability 5,201 5,393 5,477
Dental 4,007 4,284 4,560
Managed dental 4,272 3,949 —
Vision 3,508 3,088 2,614
Medicare Part D 1,248 1,509 1,870
Note 1: The information presented above should be read in conjunction with the audited consolidated financial statements and accompanying notes and Management’s
Discussion and Analysis of Financial Condition and Results of Operations included in WellPoint’s 2010 Annual Report on Form 10-K.
Note 2: Certain prior year amounts have been reclassified to conform to current year presentation.
Note 3: 2009 Total Revenue, Net Income and Earnings Per Share amounts include a gain on the sale of the NextRx Pharmacy benefit management subsidiaries.
11
Financial and
Membership
Highlights
The information presented below is
as reported in WellPoint’s 2010
Annual Report on Form 10-K.
$58.8
$65.0
$61.3
$61.2
$57.1
2010
2009
2008
2007
2006
[In billions]
33.3
33.7
35.0
34.8
34.1
2010
2009
2008
2007
2006
[In millions]
15.3%
15.0%
13.8%
13.7%
15.0%
2010
2009
2008
2007
2006
SELLING, GENERAL
AND ADMINISTRATIVE
EXPENSE RATIO
TOTAL
REVENUE
TOTAL
MEDICAL
MEMBERSHIP