Aflac 2011 Annual Report Download - page 26
Download and view the complete annual report
Please find page 26 of the 2011 Aflac annual report below. You can navigate through the pages in the report by either clicking on the pages listed below, or by using the keyword search tool below to find specific information within the annual report.-
 1
1 -
2
-
3
-
4
-
5
-
6
-
7
-
8
-
9
-
10
-
11
-
12
-
13
-
14
-
15
-
 16
16 -
 17
17 -
 18
18 -
 19
19 -
 20
20 -
 21
21 -
 22
22 -
 23
23 -
 24
24 -
 25
25 -
 26
26 -
 27
27 -
 28
28 -
 29
29 -
 30
30 -
 31
31 -
 32
32
 |
 |

24 AFLAC INCORPORATED 2011 YEAR IN REVIEW
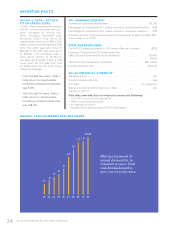
02 03 04 05 06 07 08 09 10 11
.23
.38
.44
.55
.80
.96
1.12 1.14
$1.23
.30
Aflac has increased its
annual dividend for 29
consecutive years. Total
cash dividends paid in
2011 rose 7.9% over 2010.
AFLAC’S TOTAL RETURN
TO SHAREHOLDERS
In 2011, Aflac Incorporated marked
the 29th consecutive year the com-
pany increased its annual divi-
dend. Including reinvested cash
dividends, Aflac’s total return to
shareholders declined 21.3% in 2011.
Aflac’s share price decreased 23.3%
from the 2010 year-end price of
$56.43 to the 2011 year-end price
of $43.26. This compares with a
total return decline of 20.7% for
the S&P Life & Health Index, a 2.1%
total return for the S&P 500, and
an 8.4% return for the Dow Jones
Industrial Average.
• Over the last ve years, Aac’s
total return to shareholders,
including reinvested dividends,
was 5.8%.
• Over the last 10 years, Aac’s
total return to shareholders,
including reinvested dividends,
was 108.0%.
AFL SHAREHOLDER MIX*
Number of registered shareholders . . . . . . . . . . . . . . . . . . . . . 86,700
Percentage of outstanding AFL shares owned by institutional investors . 63%
Percentage of outstanding AFL shares owned by individual investors. . . 37%
(includes director, employee and sales force ownership of approximately 4%)
*Approximate, as of 12/31/11
FIRST SHAREHOLDERS
Cost of 100 shares purchased in 1955 when Aflac was founded . . . . . .$1,110
Number of shares those 100 shares grew into
(after 28 stock splits and/or stock dividends) . . . . . . . . . . . . . . . 187,980
shares
Value at 12/31/11 (excluding dividends) . . . . . . . . . . . . . . . . . $8.1 million
Dividends paid in 2011 . . . . . . . . . . . . . . . . . . . . . . . . . . . . .$231,215
AFLAC FINANCIAL STRENGTH*
Standard & Poor’s . . . . . . . . . . . . . . . . . . . . . . . . . . . . . . . . . AA-
Moody’s Investors Service . . . . . . . . . . . . . . . . . . . . . . . . . . . . Aa3
A.M. Best . . . . . . . . . . . . . . . . . . . . . . . . . . . . . . . . A+ (Superior)
Rating & Investment Information Inc. (R&I) . . . . . . . . . . . . . . . . . . AA-
*Ratings as of 3/1/12
Visit aflac.com and click
on Investors to access the following:
• Yo
ur AFL account through aflinc®
• A
flac’s financial information
• Acalendarofevents
• Dividendreinvestmentplan(DRIP)information
INVESTOR FACTS
ANNUAL CASH DIVIDENDS PAID PER SHARE