Aflac 2011 Annual Report Download - page 18
Download and view the complete annual report
Please find page 18 of the 2011 Aflac annual report below. You can navigate through the pages in the report by either clicking on the pages listed below, or by using the keyword search tool below to find specific information within the annual report.-
 1
1 -
2
-
3
-
4
-
5
-
6
-
7
-
 8
8 -
 9
9 -
 10
10 -
 11
11 -
 12
12 -
 13
13 -
 14
14 -
 15
15 -
 16
16 -
 17
17 -
 18
18 -
 19
19 -
 20
20 -
 21
21 -
 22
22 -
 23
23 -
 24
24 -
 25
25 -
 26
26 -
 27
27 -
 28
28 -
29
-
30
-
31
-
32
 |
 |

16 AFLAC INCORPORATED 2011 YEAR IN REVIEW
Aflac U.S.
Aflac U.S. Sales Take Off!
AFLAC PRODUCTS
We are committed to continually updating our products to ensure the ben-
efits we oer are aligned with the needs of consumers. Our ability to accom-
plish this while controlling expenses has resulted in low operating expense
ratios in the United States. This allows us to deliver excellent value to cus-
tomers while paying high commissions to traditional sales agents and our
growing broker distribution channel.
Following more than five decades where we focused on selling individu-
ally issued voluntary products, we are leveraging our market-leading status
and the strong Aflac brand as we apply these strengths to the group products
we began oering in 2009. The emphasis of our product portfolio remains
squarely on the supplemental products we’ve oered for decades. The addi-
tion of group products has expanded our appeal and created sales opportuni-
ties with larger employers, brokers and our traditional sales agents.
The longstanding goal and vision of Aflac U.S. is to be the
leading provider of voluntary insurance in the United States—a
position we’ve held for many years. Our 2011 sales results were
consistent with that vision. The Aflac sales force overcame
lingering economic challenges to generate a 6.8% increase in
new annualized premium sales for the year, which exceeded
our annual sales expectation of flat to 5% sales growth.
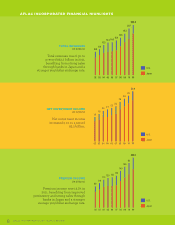
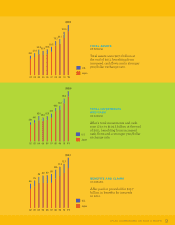
2011 FINANCIAL
HIGHLIGHTS:
Premium income
increased 3.4% to $4.7
billion, up from $4.6
billion in 2010.
Total revenues were
up 3.8% to $5.3 billion,
increasing from $5.1
billion in 2010.
Pretax operating earnings
declined slightly by .8%
to $917 million, compared
with $924 million in 2010.
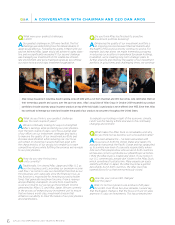
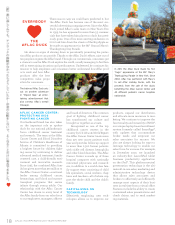
Keeping our promise to our policyhold-
ers is paramount to our business. Our
policies are designed to help protect
our policyholders when they need it
most. Dawnn Johnson, Aflac special
projects coordinator (right), has been
helping employees at RLJ Companies
since 2006 obtain Aflac policies that
best suit their needs and to file claims
when a health event occurs. Jerry
Johnson, vice president of RLJ Equity
Partners, knows that he can rely on
Dawnn, as well as Aflac policies, to help
him during his time of need. He com-
mented, “Aflac has given me peace of
mind with the company’s outstanding
customer service, the overall quality of
the corporation and its delivery mecha-
nism. If you need the service it’s quick,
it’s on time and hassle free.”