Aflac 2011 Annual Report Download - page 24
Download and view the complete annual report
Please find page 24 of the 2011 Aflac annual report below. You can navigate through the pages in the report by either clicking on the pages listed below, or by using the keyword search tool below to find specific information within the annual report.
AFLAC INCORPORATED INVESTMENT SUMMARY
22 AFLAC INCORPORATED 2011 YEAR IN REVIEW
INVESTMENT PORTFOLIO BACKGROUND
Our investment portfolio fortifies the most important promise Aflac makes to policyholders—to
protect them when they need us most by paying claims, and paying them promptly.
We primarily invest for the long term, and the strong cash flows from our persistent book of
business give us the ability to continue to invest from this perspective. Historically, our product
needs and liability profile have been key drivers to our asset strategy. Our goal is to have a port-
folio matched by duration and currency.
• In Japan, our products are yen-denominated, long-dated and have high persistency,
thus yielding long-duration liabilities.
• Our U.S. investments and policy liabilities are dollar-denominated and have shorter
durations.
CHANGING GLOBAL INVESTMENT ENVIRONMENT
Because the vast majority of our policies are in Japan, we’re predominantly invested in
yen-denominated assets around the world, including Europe. Virtually all of our investments in
Europe are yen-denominated. As the financial crisis that began at the end of 2008 transformed
the investment landscape for all insurers around the world, we began to take action to reduce our
exposure to Europe to enhance the credit quality of our investment portfolio.
ENHANCING CREDIT QUALITY
Over the last several years, we have been reducing our exposure to Europe, especially the periph-
eral Eurozone countries of Portugal, Italy, Ireland, Greece and Spain.
From January 2008 to the end of 2011 we:
• Dramatically reduced our exposure to sovereign and nancial investments in the peripheral
Eurozone countries from 5.9% to 2.2% of total investments and cash.
• Lowered our investments in perpetual securities by more than half, going from 14.7% to
6.8% of total investments and cash. None of the perpetual securities we currently own are in
peripheral Eurozone countries.
• We are not presently making any new investments in Europe and will continue to take
actions to reduce our exposure to European debt as we pursue investment transactions that
make financial sense in the evolving environment.
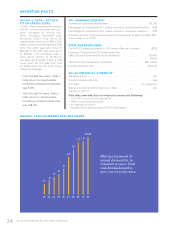
Total Investments and Cash - $101.5 Billion
34.4%
7.9%
15.3%
4.8%
5.0%
6.0%
13.4%
11.0%
2.2% Japan
Other Asia
US
Germany
UK
Peripheral Eurozone
Other Europe
Other
Cash
GEOGRAPHIC INVESTMENT EXPOSURE
(December 31, 2011, At Amortized Cost)


