Aflac 2011 Annual Report Download - page 21
Download and view the complete annual report
Please find page 21 of the 2011 Aflac annual report below. You can navigate through the pages in the report by either clicking on the pages listed below, or by using the keyword search tool below to find specific information within the annual report.-
 1
1 -
2
-
3
-
4
-
5
-
6
-
7
-
8
-
9
-
10
-
 11
11 -
 12
12 -
 13
13 -
 14
14 -
 15
15 -
 16
16 -
 17
17 -
 18
18 -
 19
19 -
 20
20 -
 21
21 -
 22
22 -
 23
23 -
 24
24 -
 25
25 -
 26
26 -
 27
27 -
 28
28 -
 29
29 -
 30
30 -
 31
31 -
32
 |
 |

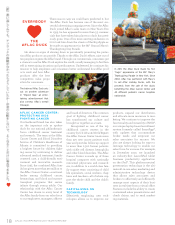
“Looking back, I do not know what we would have done without the help of this Aflac policy…it allowed us to focus on recovery instead of worrying about our finances.” – Kim Hastings, MI
The Aflac Cancer and Blood Disorders Center provides a nurturing
environment of hope for children and young adults battling cancer and blood
disorders, as well as their families. At the state-of-the-art facilities, pediatric-
trained staff members provide a unique and comprehensive course of treatment,
both clinically and emotionally, to help children and their families throughout
their journey to recovery. The Aflac Cancer Center is recognized as one of the
top childhood cancer centers by U.S. News & World Report. Pictured, Dr. William
G. Woods, Director of the Aflac Cancer Center, visits with Robert Hart, Darby
Farnsworth, Kenneth Stewart III, Myles Horton and Breanna Campbell. These
five courageous patients reflect only a few of the thousands who count on the
expert care and compassionate staff at the Aflac Cancer Center.
OUTLOOK FOR AFLAC U.S.
We believe that Aflac is well-positioned
to capitalize on the market opportuni-
ties that lie ahead. Aflac remains com-
mitted to providing relevant, valuable
and aordable benefits that make a dif-
ference in our policyholders’ lives. We
stand out from competitors by uphold-
ing our promise to protect those we
insure when they need us most by
paying claims promptly. Our large and
growing sales force made up of tradi-
tional agents and brokers is striving
to reach the tens of millions of con-
sumers who can benefit from
our competitively priced insur-
ance protection.
AFLAC INCORPORATED 2011 YEAR IN REVIEW 19
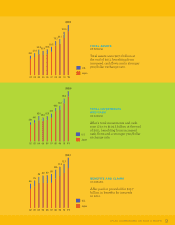
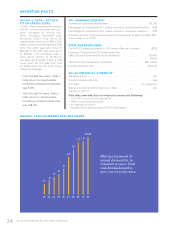
Policiesand Annualized TotalNew LicensedSales
Certicates Premiums Annualized Associates
inForce* inForce** Premiums** andBrokers
2011 11,732 $5,188 $1,476 74,802
2010 11,436 4,973 1,382 72,535
2009 11,688 4,956 1,453 75,315
2008 11,437 4,789 1,551 74,390
2007 11,116 4,510 1,558 71,258
2006 10,519 4,101 1,423 68,394
2005 9,884 3,711 1,259 63,008
2004 9,341 3,374 1,186 58,992
2003 8,805 3,043 1,128 57,493
2002 8,077 2,674 1,070 53,149
* In thousands
** In millions
AFLAC U.S. – KEY OPERATIONAL METRICS