Aflac 2011 Annual Report Download - page 22
Download and view the complete annual report
Please find page 22 of the 2011 Aflac annual report below. You can navigate through the pages in the report by either clicking on the pages listed below, or by using the keyword search tool below to find specific information within the annual report.-
 1
1 -
2
-
3
-
4
-
5
-
6
-
7
-
8
-
9
-
10
-
11
-
 12
12 -
 13
13 -
 14
14 -
 15
15 -
 16
16 -
 17
17 -
 18
18 -
 19
19 -
 20
20 -
 21
21 -
 22
22 -
 23
23 -
 24
24 -
 25
25 -
 26
26 -
 27
27 -
 28
28 -
 29
29 -
 30
30 -
 31
31 -
 32
32
 |
 |

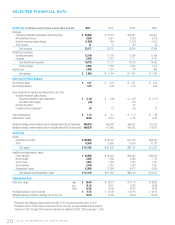
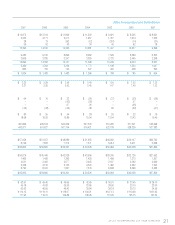
20 AFLAC INCORPORATED 2011 YEAR IN REVIEW
(In millions, except for share and per-share amounts) 201020092008
Revenues:
Premiums,principallysupplementalhealthinsurance $ 18,073$16,621 $14,947
Netinvestmentincome 3,007 2,765 2,578
Realizedinvestmentgains(losses) (422) (1,212) (1,007)
Otherincome 74 80 36
Totalrevenues 20,732 18,254 16,554
Benetsandexpenses:
Benetsandclaims 12,106 11,308 10,499
Expenses 5,041 4,711 4,141
Totalbenetsandexpenses 17,147 16,019 14,640
Pretaxearnings 3,585 2,235 1,914
Incometaxes 1,241 738 660
Netearnings $ 2,344 $ 1,497 $ 1,254
Netearnings(basic) $ 5.00 $ 3.21 $ 2.65
Netearnings(diluted) 4.95 3.19 2.62
Itemsimpactingnetearningsperdilutedshare,netoftax:
Realizedinvestmentgains(losses):
Securitiestransactionsandimpairments $ (.58) $ (1.67) $ (1.37)
Derivativesandhedging* – (.01) –
Nonrecurringitems – .02 –
Foreigncurrencytranslation** .19 .26 .23
Cashdividendspaid $ 1.14 $ 1.12 $ .96
Shareholders’equity 23.54 17.96 14.23
Weighted-averagecommonsharesusedtocalculatebasicEPS(Inthousands) 469,038 466,552 473,405
Weighted-averagecommonsharesusedtocalculatedilutedEPS(Inthousands) 473,085 469,063 478,815
Assets:
Investmentsandcash $ 88,230 $73,192 $68,550
Other 12,809 10,914 10,781
Totalassets $101,039 $84,106 $79,331
Liabilitiesandshareholders’equity:
Policyliabilities $ 82,456 $69,245 $66,219
Notespayable 3,038 2,599 1,721
Incometaxes 1,969 1,653 1,201
Otherliabilities 2,520 2,192 3,551
Shareholders’equity 11,056 8,417 6,639
Totalliabilitiesandshareholders’equity $101,039 $84,106 $79,331
Stockpricerange: High $ 58.31 $ 47.75 $ 68.81
Low 39.91 10.83 29.68
Close 56.43 46.25 45.84
Yen/dollarexchangerateatyear-end ¥ 81.49 ¥ 92.10 ¥ 91.03
Weighted-averageyen/dollarexchangeratefortheyear 87.69 93.49 103.46
*DerivativesandhedgingincludesimpactfromASC815forallyearspresentedpriorto2011
**TranslationeffectonAacJapan’sresultsandParentCompanyyen-denominatedinterestexpense
Amountsin2001through2004havebeenadjustedforadoptionofSFAS123RonJanuary1,2005
SELECTED FINANCIAL DATA