Acer 2006 Annual Report Download - page 7
Download and view the complete annual report
Please find page 7 of the 2006 Acer annual report below. You can navigate through the pages in the report by either clicking on the pages listed below, or by using the keyword search tool below to find specific information within the annual report.-
 1
1 -
 2
2 -
 3
3 -
 4
4 -
 5
5 -
 6
6 -
 7
7 -
 8
8 -
 9
9 -
 10
10 -
 11
11 -
 12
12 -
 13
13 -
 14
14 -
 15
15 -
 16
16 -
 17
17 -
 18
18 -
19
-
20
-
21
-
22
-
23
-
24
-
25
-
26
-
27
-
28
-
29
-
30
-
31
-
32
-
33
-
34
-
35
-
36
-
37
-
38
-
39
-
40
-
41
-
42
-
43
-
44
-
45
-
46
-
47
-
48
-
49
 |
 |

-3-
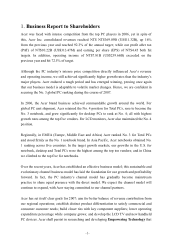
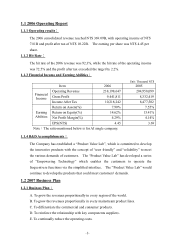
1.1 2006 Operating Report
1.1.1 Operating results:
The 2006 consolidated revenue reached NT$ 369.09B, with operating income of NT$
7.81B and profit after tax of NT$ 10.22B. The earning per share was NT$ 4.45 per
share.
1.1.2 Hit Rate:
The hit rate of the 2006 revenue was 92.3%, while the hit rate of the operating income
was 72.5% and the profit after tax exceeded the target by 2.2%.
1.1.3 Financial Income and Earning Abilities:
Unit: Thousand NT$
Item 2006 2005
Operating Revenue 238,198,647 204,958,099
Gross Profit 9,441,811 8,332,419
Financial
Income
Income After Tax 10,218,242 8,477,502
Return on Assets(%) 7.90% 7.55%
Return on Equity(%) 14.62% 13.41%
Net Profit Margin(%) 4.29% 4.14%
Earning
Abilities
EPS(NT$) 4.45 3.69
Note:The ratio mentioned below is for AI single company.
1.1.4 R&D Accomplishments:
The Company has established a “Product Value Lab”, which is committed to develop
the innovative products with the concept of “user friendly” and “reliability” to meet
the various demands of customers. The “Product Value Lab” has developed a series
of “Empowering Technology” which enables the customers to operate the
frequent-use functions via the simplified interface. The “Product Value Lab” would
continue to develop the products that could meet customers’ demands.
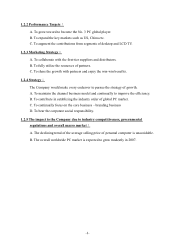
1.2 2007 Business Plan
1.2.1 Business Plan:
A. To grow the revenues proportionally in every region of the world.
B. To grow the revenues proportionally in every mainstream product lines.
C. To differentiate the commercial and consumer products.
D. To reinforce the relationship with key components suppliers.
E. To continually reduce the operating costs.