Acer 2006 Annual Report Download - page 35
Download and view the complete annual report
Please find page 35 of the 2006 Acer annual report below. You can navigate through the pages in the report by either clicking on the pages listed below, or by using the keyword search tool below to find specific information within the annual report.-
 1
1 -
2
-
3
-
4
-
5
-
6
-
7
-
8
-
9
-
10
-
11
-
12
-
13
-
14
-
15
-
16
-
17
-
18
-
19
-
20
-
21
-
22
-
23
-
24
-
 25
25 -
 26
26 -
 27
27 -
 28
28 -
 29
29 -
 30
30 -
 31
31 -
 32
32 -
 33
33 -
 34
34 -
 35
35 -
 36
36 -
 37
37 -
 38
38 -
 39
39 -
 40
40 -
 41
41 -
 42
42 -
 43
43 -
 44
44 -
 45
45 -
46
-
47
-
48
-
49
 |
 |

-31-
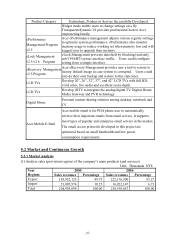
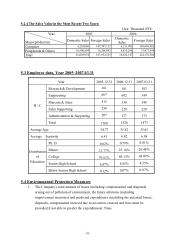
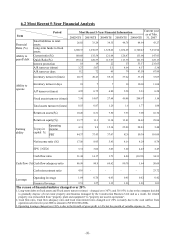
5.2.4 The Sales Value in the Most Recent Two Years:
Unit: Thousand NT$
2005 2006 Year
Major production Domestic Sales Foreign Sales Domestic
Sales Foreign Sales
Computer 4,205,080 147,747,132 6,211,901 188,698,902
Peripherals & Others 16,800,894 36,204,993 9,810,246 33,477,598
Total 21,005,974 183,952,125 16,022,147 222,176,500
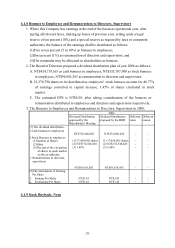
5.3 Employee data, Year 2005~2007.03.31
Year 2005.12.31 2006.12.31 2007.03.31
Research & Development 161 181 182
Engineering 667 602 549
Marcom & Sales 415 338 349
Sales Supporting 250 228 220
Administration & Supporting 207 177 173
H / C
Total 1700 1526 1473
Average Age 34.77 35.42 35.65
Average Seniority 6.41 6.82 6.98
Ph. D. 0.82% 0.79% 0.81%
Master 21.77% 25.16% 26.48%
College 70.82% 69.13% 68.09%
Senior High School 6.47% 4.85% 4.55%
Distribution
of
Education
Below Senior High School 0.12% 0.07% 0.07%
5.4 Environmental Protection Measures
1. The Company’s total amount of losses (including compensation) and disposals
arising out of pollution of environment, the future solutions (including
improvement measures) and predicted expenditures (including the potential losses,
disposals, compensation incurred due to no-action, reasons and facts must be
provided if not able to predict the expenditures): None