Acer 2006 Annual Report Download - page 42
Download and view the complete annual report
Please find page 42 of the 2006 Acer annual report below. You can navigate through the pages in the report by either clicking on the pages listed below, or by using the keyword search tool below to find specific information within the annual report.-
 1
1 -
2
-
3
-
4
-
5
-
6
-
7
-
8
-
9
-
10
-
11
-
12
-
13
-
14
-
15
-
16
-
17
-
18
-
19
-
20
-
21
-
22
-
23
-
24
-
25
-
26
-
27
-
28
-
29
-
30
-
31
-
 32
32 -
 33
33 -
 34
34 -
 35
35 -
 36
36 -
 37
37 -
 38
38 -
 39
39 -
 40
40 -
 41
41 -
 42
42 -
 43
43 -
 44
44 -
 45
45 -
 46
46 -
 47
47 -
 48
48 -
 49
49
 |
 |
-85-
6.5 Disclosure the impact in the company’s financial status if the company
or affiliates have financial difficulties in recent year and cut off by the
published date of the annual report:
Not Applicable
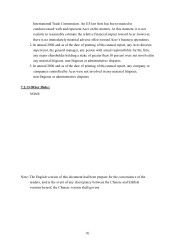
6.6 The Achievement of the Financial Prediction in the Most Recent Two
Ye a r s
6.6.1 Financial Forecast of Year 2005
Unit: Thousand NTD
Financial Forecast
of Year 2005 Audit Report of Year 2005
Item Original Aceveet Ht Rate %
Revenue 165,001,509 204,958,099 124%
C.O.G.S 157,921,717 196,625,680 125%
Gross margin 7,079,792 8,332,419 118%
Operating Expense 4,491,422 2,495,907 56%
Operating Income 1,027,292 5,836,512 568%
N
on-operating Income 3,656,790 6,163,532 169%
N
on-operating Expense 615,649 2,349,888 382%
Profit Before Tax 7,850,361 9,650,156 123%
Profit After Tax 7,200,361 8,477,502 118%
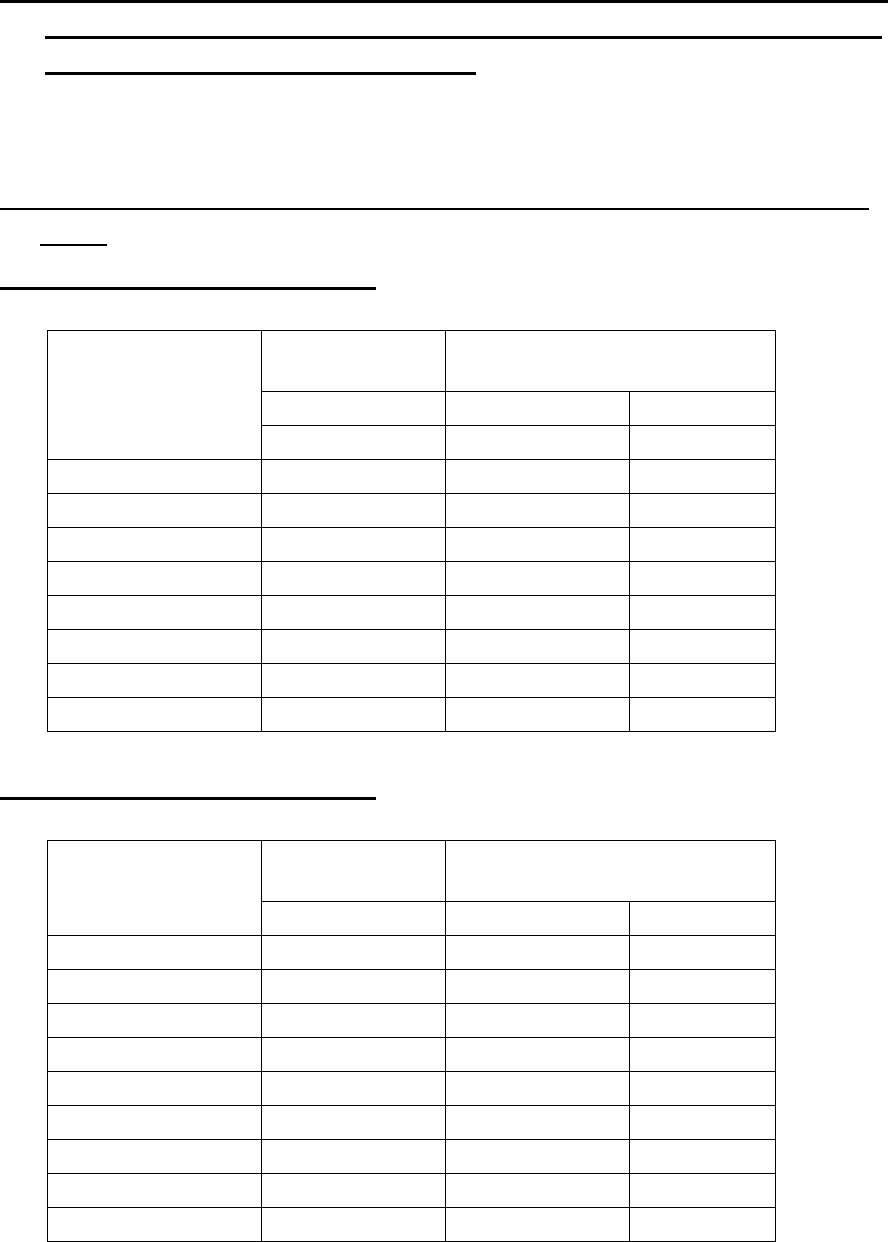
6.6.2 Financial Forecast of Year 2006
Unit: Thousand NTD
Financial Forecast
of Year 2006 Audit Report of Year 2005
Item
Original Aceveet Ht Rate %
Revenue 321,050,486 238,198,647 74%
C.O.G.S 309,719,552 228,731,399 74%
Gross margin 11,330,934 9,467,248 84%
Operating Expense 3,027,407 2,730,643 90%
Operating Income 8,303,527 6,736,605 81%
N
on-operating Income 5,360,998 7,818,967 146%
N
on-operating Expense 2,216,161 2,780,825 125%
Profit Before Tax 11,448,364 11,774,747 103%
Profit After Tax 10,018,364 10,218,242 102%